One of the readers of my last article ("Dogging the Dow . . .") asked if I could apply my criteria to the S&P 500. Indeed I could, and did - the results are below. Before discussing the S&P, however, I thought it would be worthwhile to discuss some modifications to the criteria - hopefully the last - that became desirable as I applied the criteria to a larger selection of companies.
Setting the Criteria
Using the criteria to select companies from a field of thirty candidates - as was the case with the Dow - was pretty easy, particularly since the criteria were able to pare the field down to 10 companies, and that was the precise number that was needed to compete head-to-head, as it were, with the Dogs of the Dow. To get that number, however, I had to set aside both of the performance criteria and, in the case of McDonald's (MCD), round off the quick ratio from .99 to 1.
Both steps were okay. I make no bones about the criteria being "fundamentally fundamental" in nature, and that the (technical) performance data, while designed to guide the selection to those companies that are generally moving upwards, are not essential to the functioning of the criteria. Next, while there is a difference between ".99" and "1," for a company as large as McDonald's the difference is a drop in the bucket, so rounding off would seem to be permissible.
I didn't need to cut corners with the S&P 500. With everything in place except the performance criteria there were over 100 candidates. Adding both performance criteria narrowed the field down to 69 candidates. In the earlier uses of the criteria I had included a filter for dividend yield, but that was when I was looking for companies that offered double-digit dividends; however, there aren't any companies in the S&P 500 that satisfy the criteria and offer yields of 10% or more. By fiddling around, it turned out that a dividend yield filter of > 2% gave over 20 candidates, where a filter of > 3% left only six candidates.
However, dividend yield - while certainly an important factor in selecting an investment - is not as important as the fundamentals underlying a company. My primary concern in developing the set of criteria I've been using has been identifying just those companies that offer sound fundamentals. If the criteria are letting too many companies through, they need to be strengthened.
One of the things I look for when I consider an investment is the level of debt a company has, and its ability to pay that debt. The criteria as they were being applied addressed the management of the company, its ability to generate revenue, its ability to pay the dividends it claims, and the ability to pay its debt. Nothing in the criteria, however, limits the debt a company could have. Some of my candidates have debt-equity ratios that were as high as "2+" (owing more than twice what they had in equity). As it turns out, the criteria as they currently stand do seem to limit the extent to which a company can realistically be in debt, as by removing the quick ratio filter the results include companies with debt/equity ratios of 35 or more (!); but is there a way to further limit results?
Given my choice, I would prefer to invest in companies that have no debt at all, but that is simply unrealistic for most market sectors. Some debt is almost a necessity, and is certainly a part of business. Where to draw the line, though?
Bowing to reality, then, I would prefer that a company owe less than it actually owns; that way, the company is for all intents and purposes able to cover the repayment of its obligations. (That may not be practicable, but this is coming from principle.) To be realistic and still maintain an expectation that the companies in which I invest keep debt to a minimum, I am adding a new criterion (which I expect to be the last one): the debt/equity ratio must be less than "1."
We can let this be our "final" formulation of the criteria, then:
- Return on Equity (ROE) > 0 or 1;
- Return on Assets (ROA) > 0 or 1;
- Return on Investment (ROI) > 0 or 1;
- Quick Ratio > 1;
- Debt/Equity Ratio < 1;
- Payout Ratio < 100% [or Dividend Cover > 100%];
- Operating Margin (EBIT) > 15%;
- Performance (trailing 12 months) > 0;
- Performance (most recent quarter) > 0,
(keeping in mind that the last three criteria are flexible, and that the last two are even optional). I am also going to refer to the criteria as "PIC," which is the acronym for "Pedigree Identification Criteria" (since they were used to identify the companies - the "Pedigrees" - I am testing against the Dogs of the Dow).
Of course (as one commenter observed) solid fundamentals do not equal great performance. So far, the Pedigrees of the Dow are close to, but not yet better than, the Dogs of the Dow. But in a greater sense, it's a matter of what one considers to be "great performance." Some will say that it means higher returns, while others will say that it means less chance of losing. I'll be happy to settle for a bit of each.
With that in mind, let's PIC on the S&P.
PIC-ing the Pedigrees of the S&P 500
While it isn't as popular or as widely recognized as the "Dogs of the Dow," one of the other contributors to Seeking Alpha, StockMarketPundits, has constructed "Dogs of the S&P 500": fifteen of the highest yielding companies among those making up that index. The strategy is fairly new, and a detailed result for last year's lineup is not available (although my colleague Mark, at Pundits, advises me that the list did not perform as well as the S&P as a whole - the same as happened to the Dogs of the Dow). However, there is a list for this year, and I will keep track of it - but more of that later.
There are some indicators of the S&P that can be examined: three ETFs that are based on the general S&P (rather than, say, the large caps, or the dividend growth funds). The ETFs are:
Overall, for the period of January 1, 2012 (actually, at closing of December 30, 2011) through December 31, 2012, the S&P 500 moved upward by 13.4% (approximately) - to 1,426.19, up from 1,257.60. The three ETFs above fared a bit better:
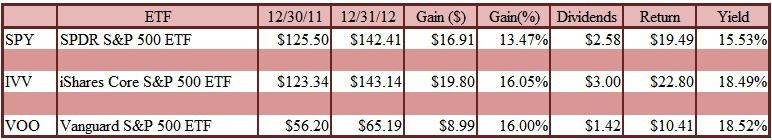
All three ETFs out-performed the S&P, SPY by ~ 210 BPS, IVV and VOO by larger margins, ~ 500 BPS.
Can we PIC better performance?
Using PIC, approximately 50 companies were selected. These companies are all fundamentally sound within the parameters established by PIC; what remains is to determine how to choose from the resultant list. Here there is perhaps a lesson to be learned from the Dogs of the Dow: let the selection be based on the highest dividend yields on the list.
Limiting the list to ten companies, here are the Pedigrees of the S&P 500 (references to the companies' performances for last year include dividends paid):
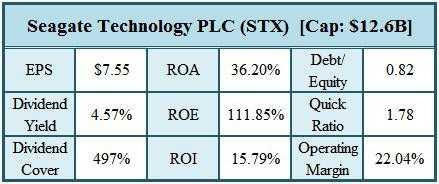
Seagate Technology (STX) is one of the more prominent names in data storage devices. In 2012, Seagate returned a noteworthy yield of 105% . Share value reached $30.42, up from $15.57 at the start of the year. It is one of five technology-related companies on our list of Pedigrees.
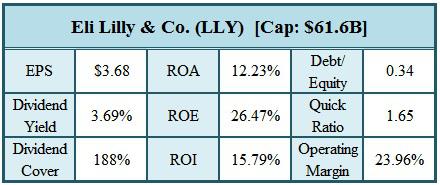
Eli Lilly & Co. (LLY) is one of three pharmaceutical - and four biomedical - firms on our list. They currently have more than 20 drugs on market, notably in the area of the treatment of diabetes. Their drug pipeline has more than 60 drugs in Phase I, II, III or Review levels of research or which are being investigated for additional treatment or reformulation. Their total yield for 2012 was 29.17%.
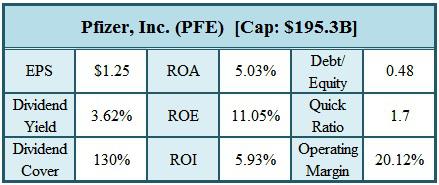
Pfizer Inc. (PFE) is the largest U.S. drug manufacturer, accounting for well over 100 prescription and over-the-counter drugs currently on the market. Pfizer also has an active drug pipeline with over 70 drugs in various levels of development. Having lost exclusive rights to Lipitor, Pfizer is preparing to release a treatment for Rheumatoid Arthritis - tofacitinib - which is being touted as its next "Lipitor" in terms of application and popularity. Last year, Pfizer had a total yield of 24.63%, and has increased its dividends for 2013 by ~ 9%.
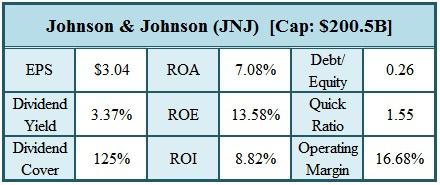
Johnson & Johnson (JNJ) joins Lilly and Pfizer as one of the three pharmaceutical companies on the Pedigree list; however, while Johnson & Johnson accounts for 25 prescription drugs and a wide variety of consumer products and over-the-counter medicines, they also have a significant position in the medical supply and the medical-device technology areas. Last year, Johnson & Johnson yielded a 14.64% return to their investors. (It is worth noting that both Johnson & Johnson and Pfizer are also Dogs of the Dow and Pedigrees of the Dow.)
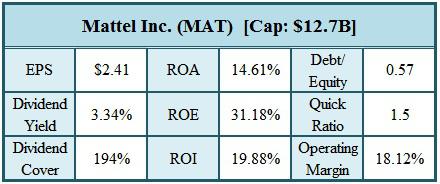
Mattel Inc. (MAT) is the only company on our list that is not in either the medical/healthcare or technology sectors. Mattel is also, arguably, one of the most recognizable names on our list of Pedigrees, and influences people from their earliest years through the rest of their lives. Fortune has identified Mattel as one of the "100 Best Companies to Work for", and Corporate Responsibility lists them as one of the "100 Best Corporate Citizens." Last year, they rewarded investors with a 41.48% yield.
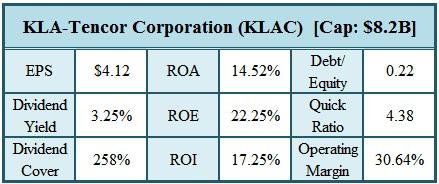
KLA-Tencor Corporation (KLAC) is involved in the semiconductor, nanotechnology, and other technology industries. Their products facilitate defect inspection and yield management. Last year they achieved a total yield of 5.28%.
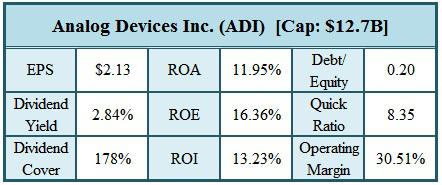
Analog Devices Inc. (ADI) is recognized as one of the top 100 innovative companies in the world, having been selected for inclusion in Thompson Reuters Top 100 Global Innovator program for both 2011 and 2012. ADI specializes in technology for data conversion and signal conditioning. Their yield for 2012 was 24.74%.
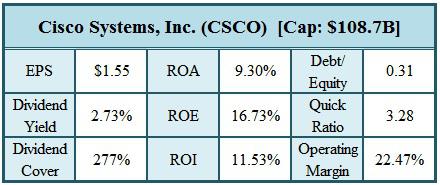
Cisco Systems, Inc. (CSCO) is one of the leaders in networking technology at every level - from home networks to enterprise systems. Last year, Cisco realized a yield of 14.08%.
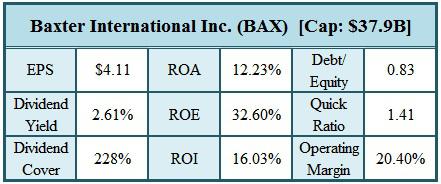
Baxter International Inc. (BAX) is a global, diversified healthcare company involved in the development of medical devices, pharmaceuticals and biotechnology for a wide range of chronic and acute medical conditions. In 2012 Baxter stock realized a significant yield of 41.67%.
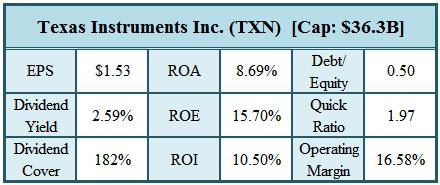
Texas Instruments Inc. (TXN) manufactures a broad array of products many of which are integral to our everyday lives. Their primary focus is on semiconductor and signal-processing technology. TI achieved a yield of 11.26% in 2012.
How did these companies perform as a group? As the table below indicates, the total yield for these companies - including dividends paid - was 31.21% - far exceeding the performance of the S&P 500 as a whole, and significantly higher than any of the ETFs listed above.
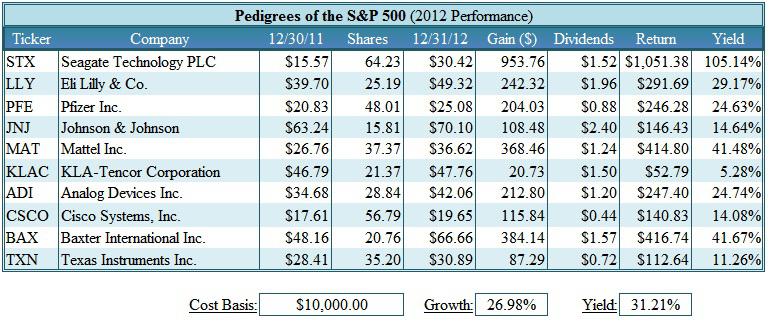
(The data for the table is based on a cost basis of $10,000 divided evenly between the ten companies. "Growth" refers to the increase in stock price alone, while "Yield" refers to the total realized increase in value, including dividends paid.)
It is clear that a major factor in the growth and yield of the "Pedigrees" was the performance of Seagate, and that kind of performance is not the sort one expects to see on a regular basis. Realistically, I would expect a total yield just above the kind of yield the ETFs realized. (Factoring Seagate out of the data, the growth of the remaining nine companies was 19.38%, with a total yield of 23%. This seems like a more realistic level of performance.)
As mentioned earlier, a fellow contributor has constructed a list of what he refers to as the "Dogs of the S&P 500." He lists 15 companies in all; however, I will follow only the top ten companies, so as to keep a balanced playing field. The companies are:
- Pitney Bowes Inc. (PBI)
- Windstream Corporation (WIN)
- R.R. Donnelley & Sons Co. (RRD)
- Frontier Communications Corporation (FTR)
- CenturyLink, Inc. (CTL)
- Cliffs Natural Resources Inc. (CLF)
- Exelon Corporation (EXC)
- Altria Group Inc. (MO)
- Pepco Holdings, Inc. (POM)
- Reynolds American Inc. (RAI)
To get an idea of how they stack up against the Pedigrees of the S&P 500 that have been PIC-ed, I subjected them to the same "test." Here is how they performed as a group last year:
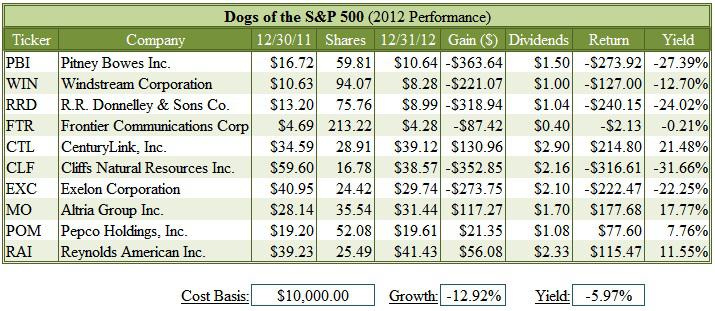
While the performance of the Dogs is almost diametrically opposed to that of the Pedigrees, there is much to give one pause here. It is clear that most of these companies are coming off bad years, resulting in fairly substantial dividend yields. The issue, then, is whether these companies can pull out of the dive they are in - and I think it is a distinct possibility in many cases.
In particular, Cliffs Natural Resources has had to deal with a weak market for iron ore which has no doubt impacted the company's operations both with respect to mining iron ore and mining metallurgical coal. The iron market does appear to be recovering now, and China is apparently ramping up its steel production. This bodes well for Cliffs' recovery.
Whether an improved economy would benefit companies such as Windstream and Frontier, however, will not be so easy to determine. Pitney Bowes and R.R. Donnelley are transitioning from one market place to another - Pitney, in response to the troubled U.S. Postal Service (its principal customer), is moving to the internet, as is R.R. Donnelley, as print media is gradually being supplanted by digital media. Both companies will be interacting with a set of competitors many of which have been designed with the digital environment in mind.
In any event, one would expect that at least some of the companies that took substantial hits in 2012 to begin turning things around in 2013. That could make the Dogs of the S&P a formidable opponent for the Pedigrees of the S&P, all of which are coming off winning years.
As I am doing for the Dogs of the Dow and the Pedigrees of the Dow, I will keep track of the S&P "kennels" on my Instablog with weekly updates. Although we're already well into the month of January, I will take the starting point at the beginning of the year and proceed from there. I will also track the performance of the three ETFs - SPY, IVV and VOO.
If nothing else, it will give me something to do on Friday nights.
Thanks to The Motley Fool, Yahoo! Finance, Google Finance and FINVIZ for the data used in this article. Thanks also to StockMarketPundits for permission to pick on their Dogs.
Disclaimer: The investment "strategies" discussed in this article, and the companies picked thereby, should not be taken as recommendations, but only illustrations of the application of investment techniques. I am not personally recommending that anyone invest in these companies - investors should do their own research using their own due diligence before making any investment. The same considerations apply to the Dogs of the Dow and the Pedigrees of the Dow.
Disclosure: I am long PFE. I wrote this article myself, and it expresses my own opinions. I am not receiving compensation for it (other than from Seeking Alpha). I have no business relationship with any company whose stock is mentioned in this article.