"There is never enough gold to redeem all the currency in circulation"
- John Buchanan Robinson
The recent request by the Bundesbank to repatriate their gold reserves held in foreign central bank vaults has brought gold (GLD) back into the minds of the investing public and there has been a lot of speculation lately as to whether gold is on the verge of an upside breakout. With it come all kinds of predictions and prognostications and I think the discussion has digressed without a meaningful framework. In this article I am going to try to put some facts around the gold discussion and create a framework on which you can base your gold pricing models.
One of the most popular arguments for the spike in the price of gold that has occurred since 2005 is The Fed easy monetary policy. The tripling of The Fed balance sheet since 2008 has coincided with a tripling of the gold price for the same time period. That has led some people to believe that there is a direct correlation between the gold price and the money being printed. Since the monetary base (MB) is money available to the banks but not the economy, we can't really use the MB as an indicator with which to measure the money supply. Once the banks lend the money out into the economy in the form of credit then it actually becomes currency in circulation. This is measured by the M2 money stock supply. As we will soon see the correlation between the money supply and gold price is a myth.
The Maximum Price of Gold - MPG
To begin this investigation, I will ask the following question - can all the dollars in the world buy all the gold in the world?
A quick look at the All the World's Gold website reveals that the total value of all the world's gold at the beginning of 2012 is 8.5 trillion dollars. A quick look at the Federal Reserve Bank of St.Louis website reveals that the M2 money stock sat at 10.5 trillion dollars at the beginning of 2012. So John Buchanan Robinson is right - all the world's gold can't redeem all the currency in circulation. He is also onto something else: the maximum price of gold is reached when all the world's gold value - AWG - exceeds the available supply of M2 money stock. Since the US dollar is the reserve currency of the world, this is truly the most appropriate measure to use in evaluating gold's worth. At that point everything else in the world - factories, products, real estate, other commodities, labor - is essentially valued at 0 in the reserve currency. When everything else in the world has zero value that is when you know you have a true bubble.
Maximum price of gold ($/oz) = M2 money stock ($) / All the world's gold stockpile (oz)
For the beginning of years 2012 and 2011 that would have been:
MPG (2012) = $10.4 trillion/(165,000 metric tons * 32,150 troy ounce) = $1,974
MPG (2011) = $9.6 trillion/(162,340 metric tons * 32,150 troy ounce) = $1,844
Do these numbers look familiar? In September of 2011, the Gold price peaked at $1895/oz (according to kitco.com) right in the middle of the suggested range for the 2011 calendar year. For a week, the AWG matched the M2. Within 2 weeks of the peak, the gold price declined below the 2011 benchmark of $1,844 and never looked back.
M2G Ratio
To frame the pricing discussion for gold, I am happy to introduce a new benchmark - the M2G Ratio. It is simply the ratio between the M2 money stock and all the world's gold value:
M2G ratio = M2 / AWG
Let's look at the historical numbers for the M2G ratio since 1981. For reference, my data sources are:
M2 money stock - Federal Reserve Bank of St. Louis
Gold price per troy ounce - Kitco
Annual gold production - US Geological Survey (USGS)
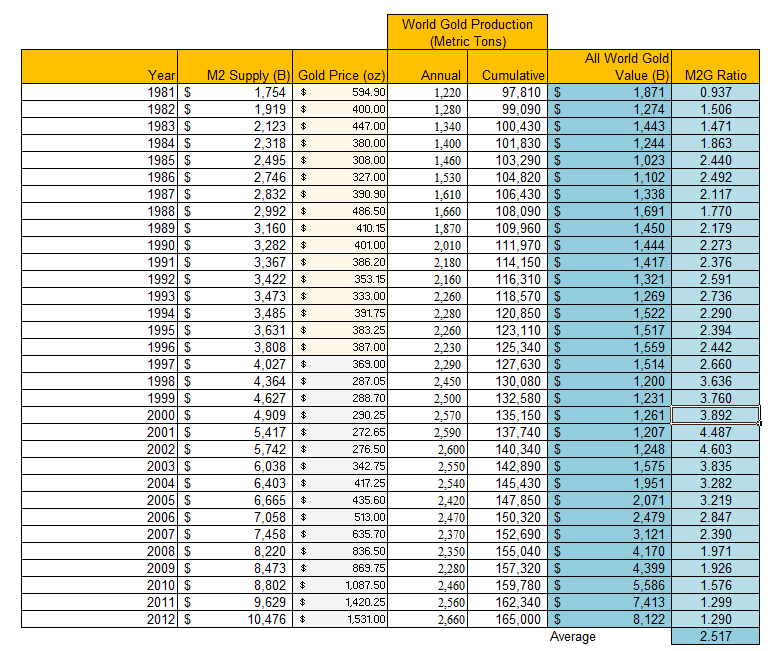
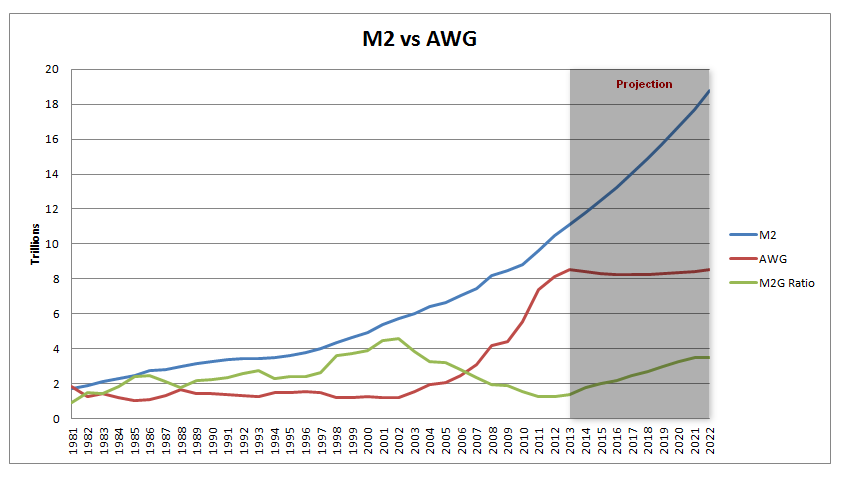
The very first thing this chart tells me is that there is no correlation between the money supply and the value of gold. For 20 years between 1981 and 2001, the AWG value stayed at the same levels while the M2 stock tripled. The M2G ratio went from 0.94 in 1981 to peak at 4.6 in 2002. Since 2002, the M2G ratio is in mean reversion mode, crossed the average of 2.5 in 2006 and now seems to be hitting 30 year lows of 1.3 for the last 2 years. The chart of the M2G ratio looks cyclical so my inner chartist tells me that the next 10 years might be spent in mean reversion mode with the M2G ratio increasing, reaching 2.5 by year 5 (2017) and then overshooting to about 3.5 by year 10 (2022).
10 Year Outlook
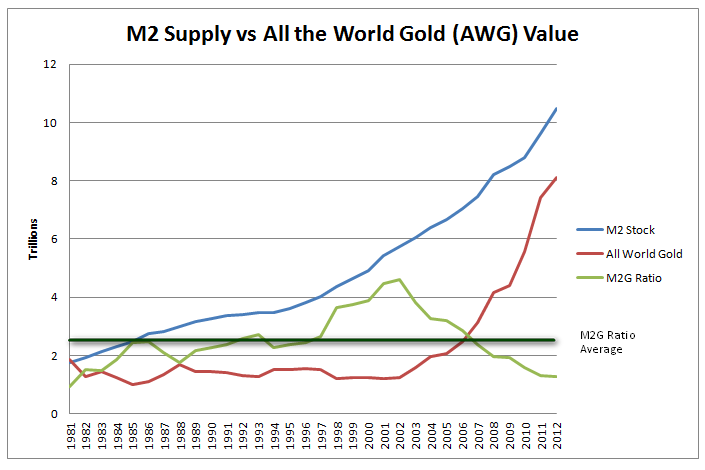
I don't claim to be Nostradamus. I am generally a short-term type of guy. I have lived long enough to see enough black swans and neon swans (something that is blatantly obvious, but you misjudge the consequences) that have screwed up the best of intentions and prognostications so I tend not to think too far in the future. However, gold is the one metal that can corrupt my weak mind, so I will hereto digress. I would like to provide a 10-year outlook for the price of gold and it is based on the following assumptions:
- M2 increases at 6% per year (which is the 30-year average increase from 1981 to 2011)
- Annual world gold production increases at 2.6% per year (again 30-year average)
- The M2G ratio increases from 1.3 to 3.5 in 10 years based on an assumption that it is cyclical in nature

$850 in 2022! This is almost exactly half from the current levels. And a long painful decline that is lasting about 10-years before the price depreciation reaches its nadir. The AWG is declining pretty rapidly from about $8 trillion to around $5 trillion. This looks like a pretty earth shattering development and I doubt that AWG will decline that dramatically. Even in the 80's when the M2 tripled, the AWG stayed roughly at the same level and it didn't lose significant ground. This makes me doubt the validity of this projection.
Let's try again
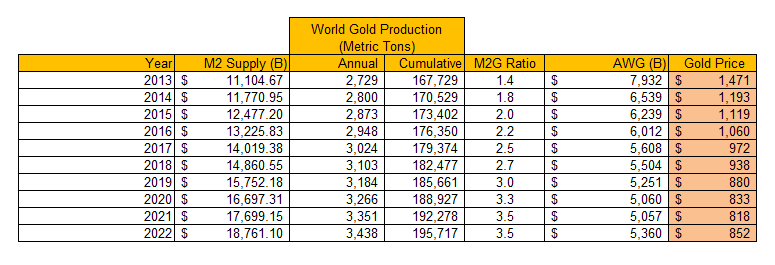
The key driver here is my hypothesis that the M2G ratio will spend the teens increasing rapidly. Let's suppose that doesn't occur and instead the M2G ratio stays range-bound. Let's try this projection again with a "status quo" M2G ratio:
- The M2G ratio slowly increases from 1.3 and 2.2 for 10 years
This looks like a more realistic chart. The AWG stays at a steady level, while the M2 is steadily increasing, reminiscent of the 80s. If we go through a period where the economy is growing at 3.5%-4%, the labor market is stable, the interest rates are rising and the investment money flows get reallocated from gold and bonds to more productive and risky assets, it is not far-fetched to see a future for the gold prices that looks like the table above suggests - range bound between $1300-$1600 for a period of 10 years (similar to the 80s). For your reference, in the table above I have also included the projected maximum price of gold - MPG column.
Conclusion
I am not a gold bull neither am I a gold bear. I don't think you should short gold. I don't think you should be long gold. I think if you are gold holder, you should cash in your holdings and reinvest them in something that pays a dividend or matches the market return (SPY). If you want to play the commodity space, my suggestion would be to start focusing more on palladium (PALL), platinum (PPLT), silver (SLV) and copper (JJC). If you do believe strongly in gold, I suggest allocating maximum 20% in your commodity portfolio with the remaining 80% invested in the industrial commodities mentioned above. They will face rising demand in an improving economy and I think their price will decouple from the price of gold in the near future and there is simply more upside to be had there.
Disclosure: I have no positions in any stocks mentioned, and no plans to initiate any positions within the next 72 hours. I wrote this article myself, and it expresses my own opinions. I am not receiving compensation for it (other than from Seeking Alpha). I have no business relationship with any company whose stock is mentioned in this article.