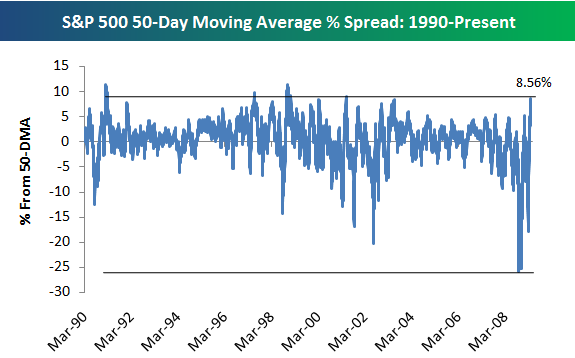
The S&P 500 is currently trading 8.56% above its 50-day moving average, which is its most overbought reading since May 2001. As shown in the historical 50-day moving average spread chart of the S&P 500 below, these levels are rarely reached, and when they are, pullbacks or sideways trading usually ensues. However, oversold levels hit multi-year extremes and kept getting more and more oversold at the end of 2008. While it's likely that the market will take a breather, anything can happen in this market.