The complete set of U.S. economic indicators for March is finally in, so let's take a look at how the U.S. economy performed.
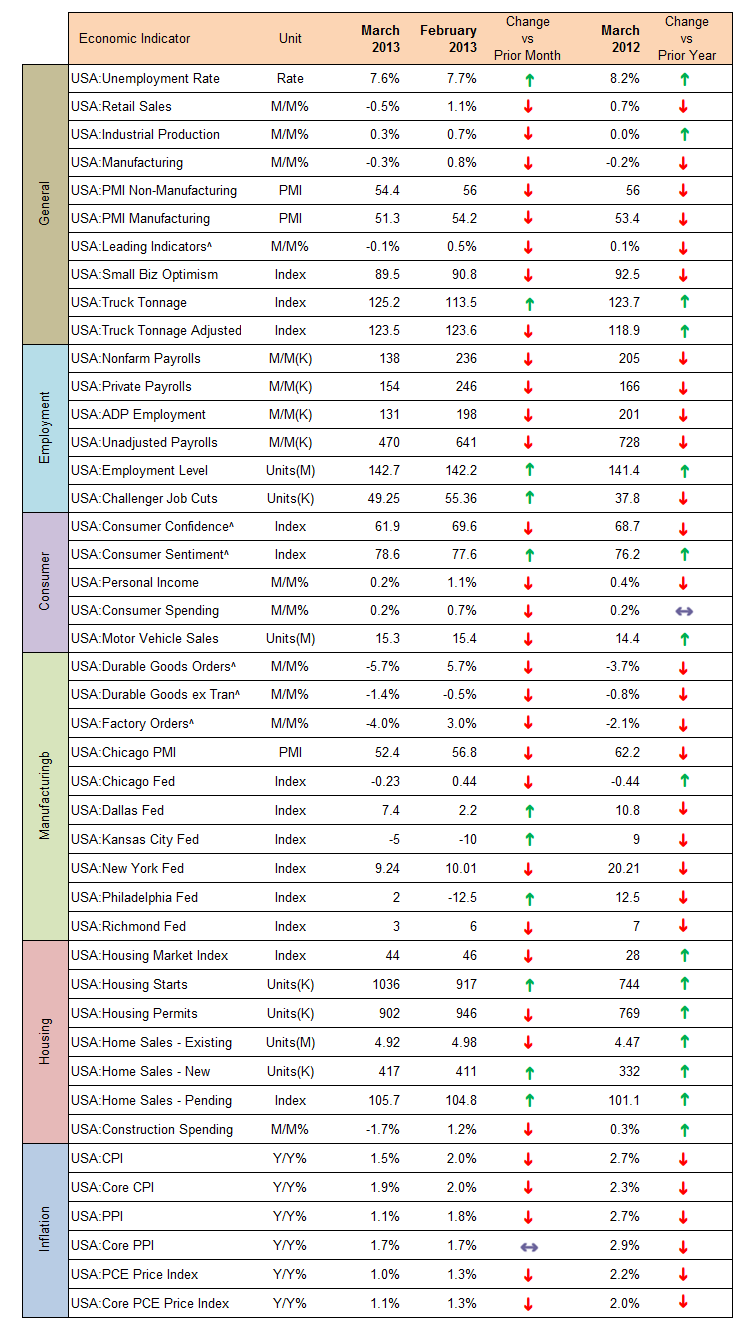
The spring swoon in the economy arrived early this year helped by a double whammy of payroll tax increases and the enactment of the sequester on March 1, 2013. There is some good news, but mostly bad news. Let's start with employment. The unemployment rate continues to go steadily down helped by positive employment numbers, however, job creation was not up to par for the season. Both non-farm payrolls, private payrolls and ADP employment registered weaker numbers compared with the prior month and the prior year. They are positive so the overall effect on the economy is positive, however, they reflect a job market that is stuck in steady-as-she-goes mode and is far away from generating the 250,000 jobs per month that are necessary to keep up with population growth. While the overall employment level is up, the economy is adding fewer jobs than it did last year.
Source: macrochart.com
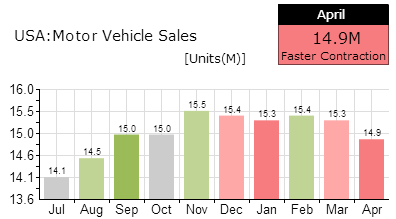
On the consumer front, consumer confidence data is mixed as the two surveys are not in sync. The University of Michigan Consumer Sentiment survey shows consumer confidence staying pretty much the same, while the Conference Board Consumer Confidence is coming down. When both surveys diverge that means the consumer story is status quo - neither better nor worse than before and the same as in 2012. More worryingly, personal income and consumer spending are growing at a weaker pace probably reflecting the effects of the payroll tax increases that hit the majority of the U.S. population in January. The PMI Services also came in weaker than usual for March, although a 54.4 reading still reflects a healthy level of growth. Motor vehicle sales are starting to plateau, which means consumers are less optimistic about their longer-term prospects.
Source: macrochart.com
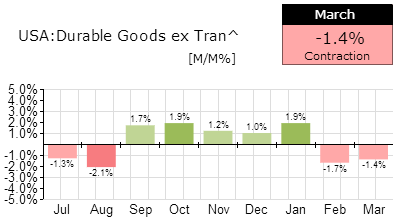
On the manufacturing side, the situation is getting really ugly. Durable goods orders are down big with or without transportation. The ISM PMI Manufacturing index came in at 51.3, which was almost 3 points lower than the prior month and 2 points lower than last year, yet still registered a reading in expansion territory. Factory orders are collapsing at the rate of -4% and are down for a second consecutive month. The regional Fed surveys report mixed data and for the most part the readings are lower than they were last year reflecting the negative effects of the sequester. Investment seems to be down despite the tax certainty achieved in the Fiscal Cliff deal. This doesn't bode well for the longer-term employment and personal income picture going forward in 2013.
Source: macrochart.com
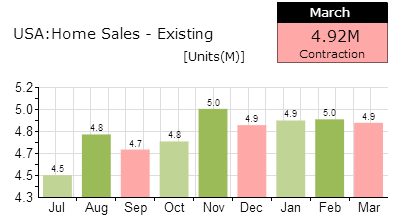
On the housing front, we are in a much better shape than 2012, but the housing market index, housing permits, existing home sales and construction spending are starting to plateau, which means that the housing recovery may be starting to exhaust itself. Maybe some of the numbers can attributed to the unseasonably cold weather in March, we will need to see the April numbers to get a clearer picture on housing.
Source: macrochart.com
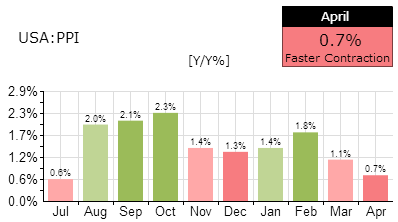
On the inflation front, general inflation is down reflecting weaker commodity prices such as oil, copper, and grains. The effects of disinflation are even more apparent in the producer price index, which is sitting at a paltry 1.1%. Core inflation is still running at 2%, right at the level the Fed wants it to be, which means that the Fed has absolutely no reason to expand its bond buying program. Given competitive currency devaluations by central banks, this is positive for the U.S. dollar and will lead to a continued suppression in the price of most commodities through the summer.
Are Japanese money stampeding to the U.S.?
While the economy is starting to slow down and stall, we can't say that this is totally unexpected. Economists foresaw the spring swoon with the sequester providing a major headwind for manufacturing and the payroll tax increase for consumption. We are here now, yet the stock market has continued to rally. There is a major disconnect between the economic data and the stock market. Going forward, the expectations are that either the economy is going to pick up and catch up with the stock market or the stock market is going to come down and align with the economic reality. While both are reasonable expectations, I think what is going to happen is a third scenario - the economy is going to continue to plod along while the market continues to rally fueled by an unprecedented wave of liquidity provided by central banks. While some may blame the Fed for that, I don't. As I have outlined previously the Fed QE program doesn't directly affect the money supply and the Fed is not authorized to invest in the stock market directly. As such I don't think the rally is really fueled by the Fed other than market participants having a certain degree of certainty that the Fed will not tighten lending conditions any time soon.
I think the market rally is exclusively fueled by the Bank of Japan quantitative easing program. The BOJ will double the yen monetary base over the next two years in an attempt to devalue the spectacularly high 210% debt-to-GDP ratio of Japan. The BOJ has telegraphed its intentions very clearly. Faced with a massively depreciating currency, what is a Japanese saver and investor to do?
Get out of Japanese bonds and Japanese yen-denominated savings accounts and find safety abroad!
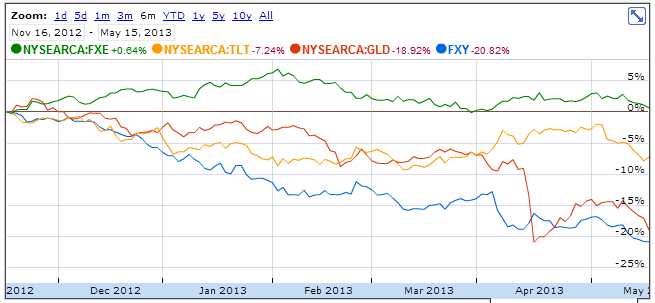
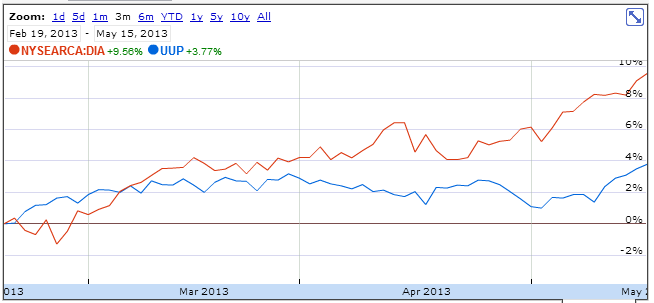
The U.S. dollar (UUP) and the U.S. stock market (DIA) and more specifically its low-volatility high-dividend stocks are the best place for conservative investors given that all alternative safe haven assets such as U.S. Treasury bills (TLT), gold (GLD), yen (FXY) and euro (FXE) are not so safe anymore:
An example of this phenomenon is Nomura (NMR) retail client assets hitting a record of $889 billion dollars last month, a goal its CEO Koji Nagai hadn't expected to hit for another two years. In April alone, Nomura saw an influx of $64 billion in assets. While some of this money will find its way into the Japanese stock market (EWJ), most, given the risk-averse nature of the Japanese, will try to find its way to best safe havens out there and those, without a doubt right now, are the U.S. dollar and the high-dividend Dow Jones Industrial Average.
Portfolio Implications
Even though the U.S. Economy seems to be sputtering it is still a lot stronger than the European economy by pretty much all measures. Continued weakness in the Chinese economy and stock market makes the U.S. stock market the destination of choice for foreign investors whether they are Japanese, Chinese or European. As such I continue to emphasize that an investor right now should remain invested in the U.S. dollar (UUP) or its leveraged counterpart UUPT. A strong dollar will lead to continued lower inflation levels, which means that I continue to recommend short exposure to commodities (DBC), gold (GLD) and oil (OIL). While gold has taken a big hit, I don't think its plight is over. Shorting on rebound is still a good move. Oil has managed to stay strong due to the Syrian crisis, but some form of resolution to that conflict and the conflict with Iran will bring over 6 million barrels of oil per day into the market. That combined with continued increases in U.S. oil production should put significant downward pressure on the oil price in the coming months. I recommend short oil exposure via a leveraged ETF such as SCO.
In the U.S., based on the economic numbers, I recommend sector exposure to financials (XLF) and transports (IYT) given the strong trucking tonnage numbers. I would stay away from industrials (XLI) until we see better numbers in regional Fed manufacturing surveys and manufacturing PMI although in a bull market everything goes up. I have to admit that I tried unsuccessfully to short the small caps (IWM) last week when the Russell 200 hit the 50-day moving average for a third time. But apparently, there may be no "Sell in May" this year. Three days later I closed the short with a small loss. I am still reluctant to invest in the S&P 500 or the Dow Jones because they are in overbought territory in every technical indicator that I track. I don't like chasing performance and since I don't have to, I just wont.
I am currently keeping a very close look on Europe as I suspect we will have a European version of Abenomics taking hold this summer. Continued weakness in the European economy will prompt the ECB to more action (it has already cut rates) and while I don't expect it to devalue the euro as aggressively as the BOJ has devalued the yen, I do expect a similar situation to develop leading to a lower euro and ironically even more buoyant European stock markets. A currency hedged ETF like HEDJ is the play here and I have already taken a position.
My portfolio currently looks like this:
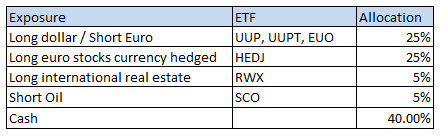
Disclosure: I am long HEDJ, RWX, UUPT, EUO, SCO. I wrote this article myself, and it expresses my own opinions. I am not receiving compensation for it (other than from Seeking Alpha). I have no business relationship with any company whose stock is mentioned in this article.