In order to create a dividend stock portfolio that can outperform the market by a big margin, I have used the following screen. It is based on an attempt to search for profitable companies that pay rich dividends and that have repurchased their own shares during the last year. Those stocks would also have to show a very low debt.
The screen's method that I use to build this portfolio requires all stocks to comply with all following demands:
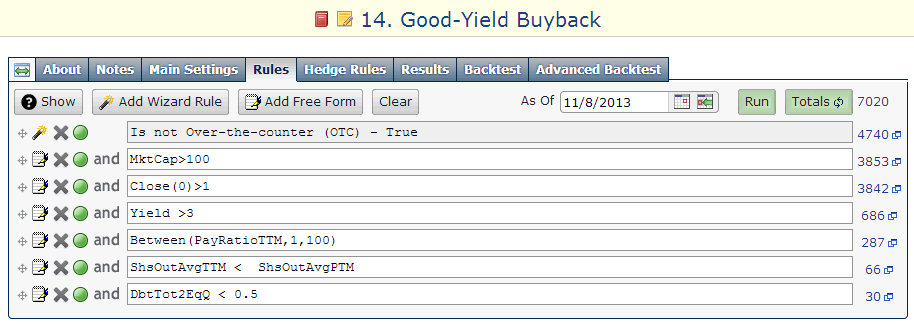
- The stock does not trade over-the-counter (OTC).
- Price is greater than 1.00.
- Market cap is greater than $100 million.
- Dividend yield is greater than 3.0%.
- The payout ratio is less than 100%.
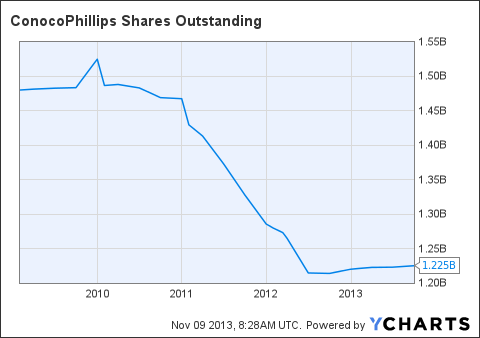
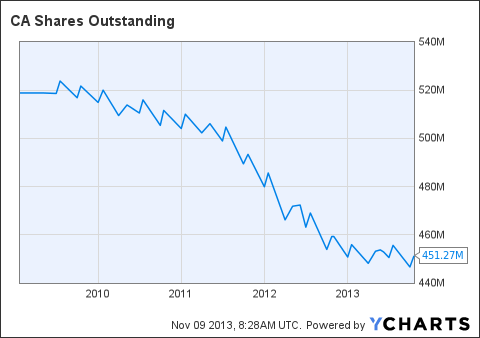
- The average shares outstanding TTM is less than the average shares outstanding for the prior year TTM.
- Total debt to equity is less than 0.50.
- The twenty stocks with the lowest payout ratio among all the stocks that complied with the first seven demands.
I used the Portfolio123's powerful screener to perform the search and to run back-tests. Nonetheless, the screening method should only serve as a basis for further research. All the data for this article were taken from Yahoo Finance, Portfolio123 and finviz.com.
After running this screen on November 09, 2013, I discovered the following twenty stocks:
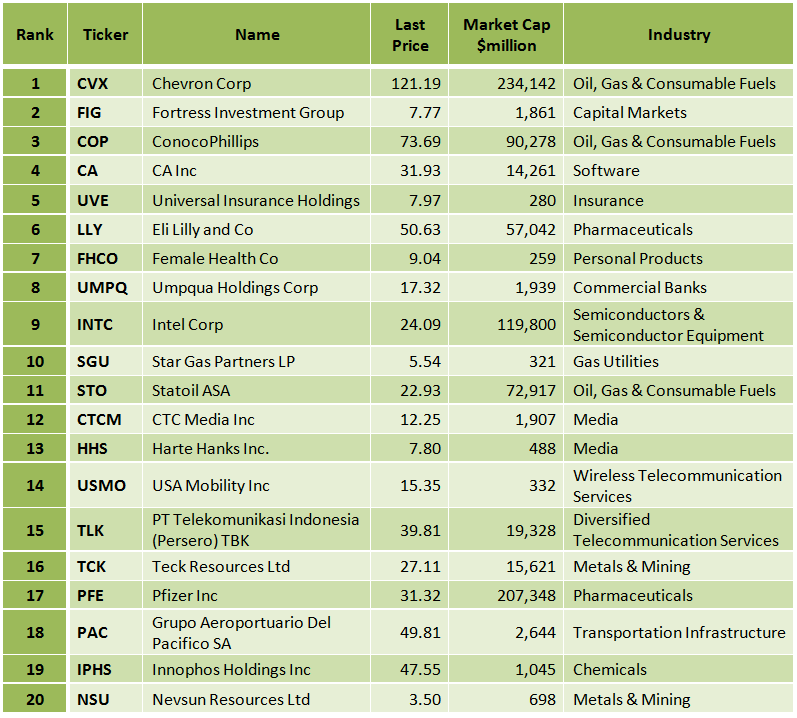
(Click to enlarge)
The table below presents the dividend yield, the payout ratio, the average shares outstanding for the trailing 12 months, the average shares outstanding for the prior year TTM, and the total debt to equity ratio for the twenty companies.
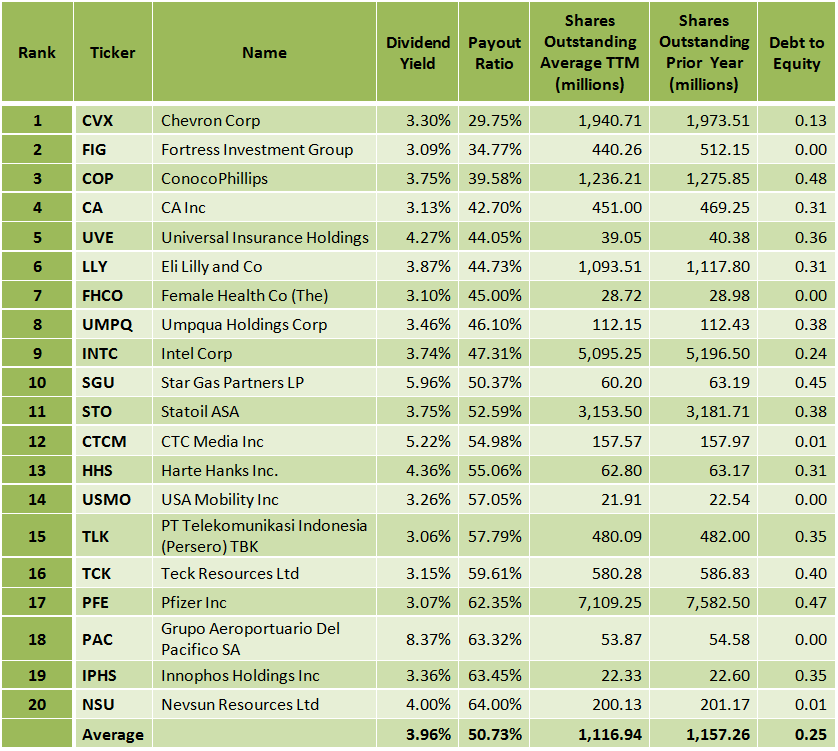
(Click to enlarge)
Chevron Corporation (CVX)
Chevron Corporation, through its subsidiaries, engages in petroleum, chemicals, mining, power generation, and energy operations worldwide.
See my article from November 03.
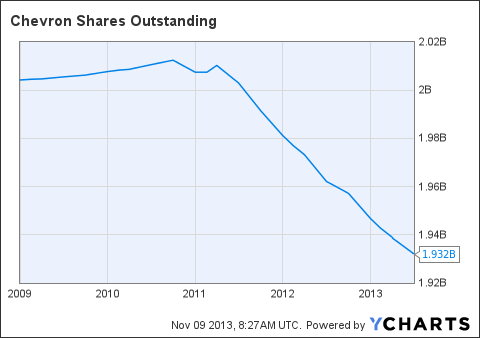
(Click to enlarge)

(Click to enlarge)
Chart: finviz.com
Fortress Investment Group LLC (FIG)
Fortress Investment Group LLC is a publicly owned investment manager.
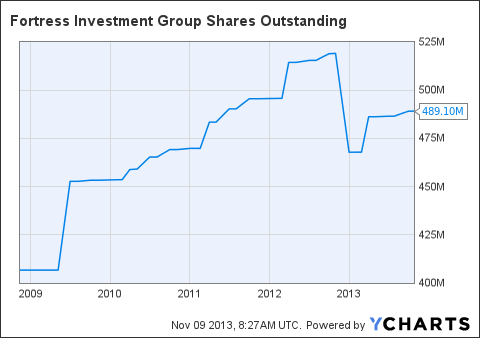

(Click to enlarge)
Chart: finviz.com
ConocoPhillips (COP)
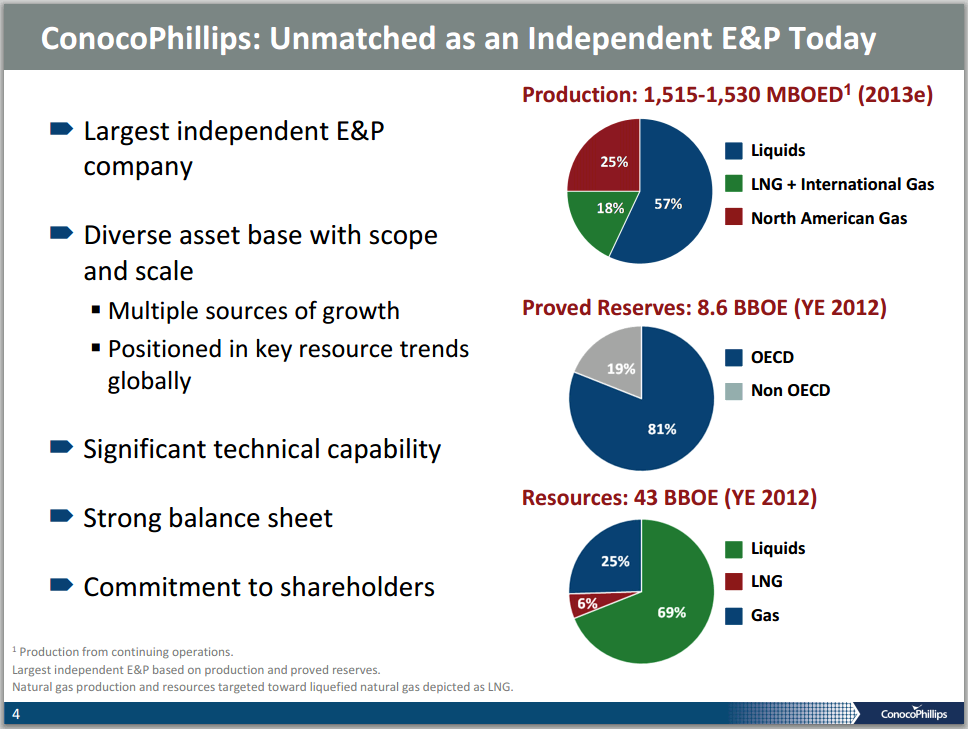
ConocoPhillips explores for, produces, transports, and markets crude oil, bitumen, natural gas, liquefied natural gas, and natural gas liquids on a worldwide basis.
(Click to enlarge)
Source: Company presentation
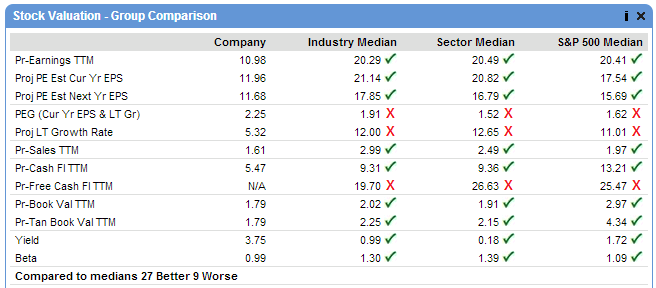
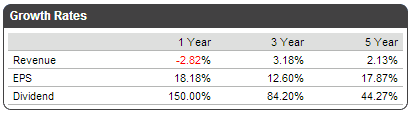
ConocoPhillips has a low debt (total debt to equity is 0.48), and it has a very low trailing P/E of 10.97 and a very low forward P/E of 11.73. The price-to-sales ratio is at 1.50, and the average annual earnings growth estimates for the next five years are at 4.73%. The forward annual dividend yield is at 3.75%, and the payout ratio is only 39.6%. The annual rate of dividend growth over the past five years was high at 14.10%.
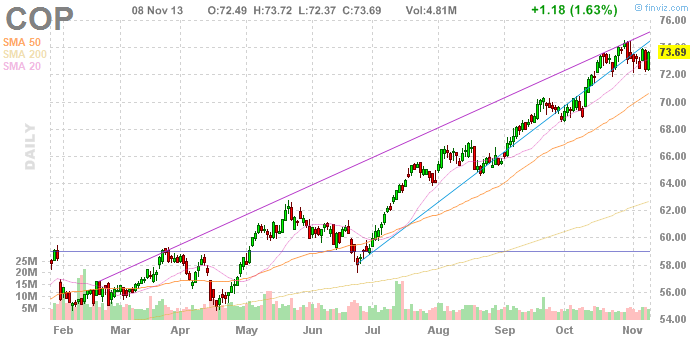
The COP stock price is 0.83% above its 20-day simple moving average, 4.51% above its 50-day simple moving average and 17.62% above its 200-day simple moving average. That indicates a short-term, a mid-term and a long-term uptrend.
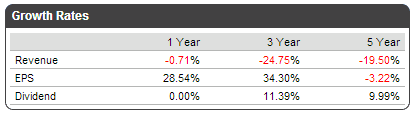
ConocoPhillips has recorded strong EPS and dividend growth and negative revenue growth during the last three, as shown in the table below.
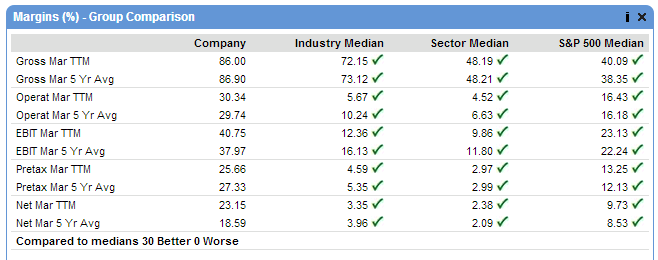
Most of ConocoPhillips' stock valuation parameters have been better than its industry median, sector median and the S&P 500 median, as shown in the table below.
(Click to enlarge)
Source: Portfolio123
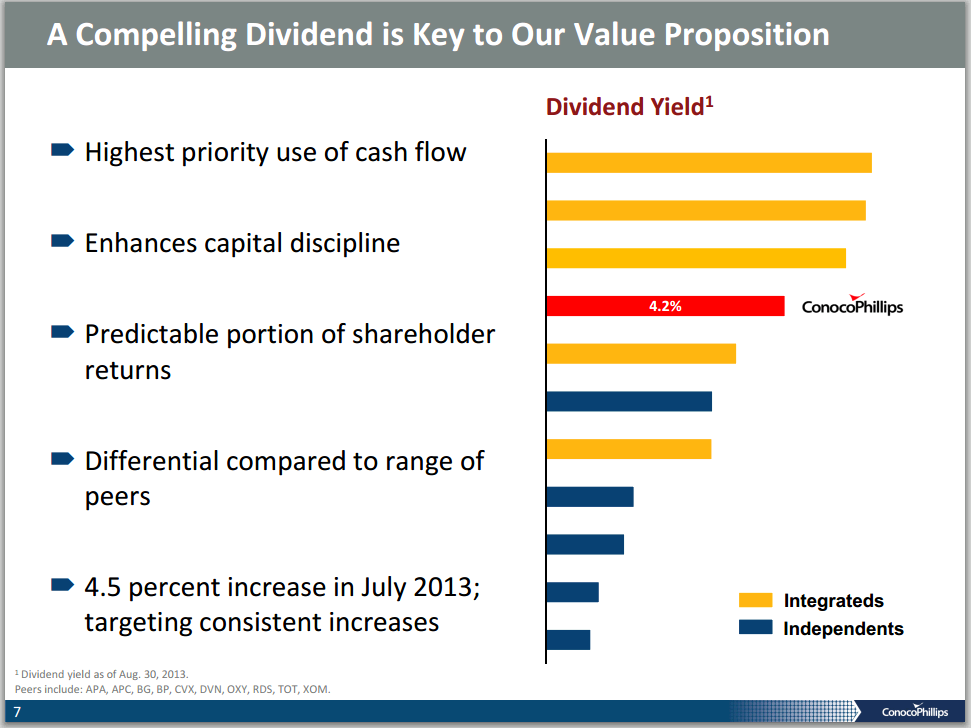
ConocoPhillips' dividend yield is among the highest in the industry, as shown in the chart below.
(Click to enlarge)
Source: Company presentation
On October 30, ConocoPhillips reported its third-quarter financial results, which beat EPS expectations by $0.02. The company reported third-quarter 2013 earnings of $2.5 billion, or $2.00 per share, compared with third-quarter 2012 earnings of $1.8 billion, or $1.46 per share.
Third-Quarter Highlights
- Achieved third-quarter guidance with production of 1,514 MBOED, including continuing operations of 1,470 MBOED and discontinued operations of 44 MBOED, which reflects two months of disruptions in Libya.
- Successfully completed major turnarounds and tie-in activities as planned.
- Eagle Ford, Bakken and Permian production increased 40 percent compared with third-quarter 2012.
- Started up major projects at Christina Lake Phase E in July and Ekofisk South in October, with final preparations underway for full-field startup at Gumusut, Jasmine and Siakap North-Petai.
- High level of exploration activity continues with drilling in the Gulf of Mexico, Australia's Browse Basin, and unconventional plays in Canada and the Lower 48.
- Completed sale of Clyden and our interest in Phoenix Park.
In the report, Ryan Lance, chairman and chief executive officer, said:
We have made significant progress toward positioning the company for 3 to 5 percent growth in volumes and margins. We successfully completed our major turnaround activity and have brought two major projects on line, with another three major projects expected to start production in the coming months. We completed the sale of our Clyden and Phoenix Park assets, and continue to make progress on our announced disposition program of additional nonstrategic assets. We met our production targets, despite unplanned disruptions in Libya, and increased our dividend rate in early July, reaffirming our commitment to shareholders.
ConocoPhillips has compelling valuation metrics, and solid earnings growth prospects, and considering the fact that the stock is in an uptrend, COP stock still has room to go up. Furthermore, the very rich growing dividend represents a gratifying income.
Risks to the expected capital gain and to the dividend payment include a downturn in the U.S. economy, and a decline in the price of oil and natural gas.
(Click to enlarge)
Chart: finviz.com
CA Inc. (CA)
CA, together with its subsidiaries, provides enterprise information technology management software and solutions that help customers manage and secure IT environments in the United States and internationally.
CA has a very low debt (total debt to equity is only 0.31), and it has a very low trailing P/E of 13.65 and a very low forward P/E of 12.46. The price to free cash flow for the trailing 12 months is at 24.54, and the average annual earnings growth estimates for the next five years is quite high at 13.50%. The forward annual dividend yield is at 3.13%, and the payout ratio is only 42.7%. The annual rate of dividend growth over the past three years was very high at 84.65% and over five years was also very high at 45.13%.
The CA stock price is 3.52% above its 20-day simple moving average, 5.41% above its 50-day simple moving average and 15.57% above its 200-day simple moving average. That indicates a short-term, a mid-term and a long-term uptrend.
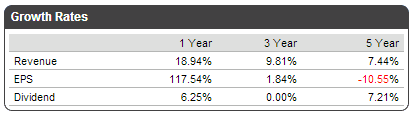
CA has recorded strong EPS and dividend growth, and moderate revenue growth, during the last year, the last three years and the last five years, as shown in the table below.
The tables below emphasize CA's superiority in terms of margins, return on capital and valuation over its industry median, its sector median and the S&P 500 median.
(Click to enlarge)
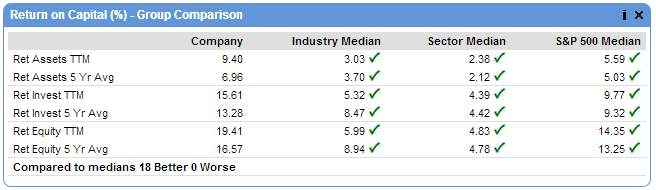
(Click to enlarge)

(Click to enlarge)
On October 24, CA reported its second-quarter fiscal year 2014 financial results. EPS came in at $0.73 a $0.13 better than analyst expectations, the company beat also on revenues.
Second-Quarter Highlights
- GAAP EPS Grows 8 Percent in Constant Currency and 10 Percent as Reported
- Non-GAAP EPS Grows 46 Percent in Constant Currency and as Reported
- Revenue Flat in Constant Currency and Down 1 Percent as Reported
- Cash Flow From Operations Declines 7 Percent in Constant Currency and 2 Percent as Reported
- Updates FY 2014 Outlook for Revenue and GAAP and Non-GAAP EPS
CA has recorded revenue, EPS and dividend growth, and considering its compelling valuation metrics, and its good earnings growth prospects, CA stock can move higher. Furthermore, the rich growing dividend represents a nice income.

(Click to enlarge)
Chart: finviz.com
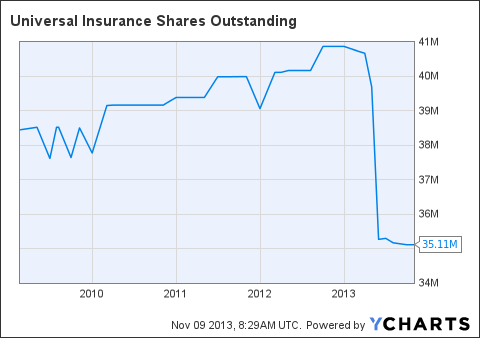
Universal Insurance Holdings Inc. (UVE)
Universal Insurance Holdings, Inc. operates as a property and casualty insurance company performing various aspects of insurance underwriting, distribution, and claims.
Universal Insurance Holdings has a low debt (total debt to equity is only 0.36), and it has a very low trailing P/E of 7.59. The price to free cash flow for the trailing 12 months is extremely low at 1.60, and the price-to-cash ratio is also very low at 1.60. The forward annual dividend yield is quite high at 4.27%, and the payout ratio is only 44%.
The UVE stock price is 5.28% above its 20-day simple moving average, 8.52% above its 50-day simple moving average and 23.26% above its 200-day simple moving average. That indicates a short-term, a mid-term and a long-term uptrend.
Universal Insurance Holdings has recorded strong revenue growth during the last year, the last three years and the last five years, as shown in the table below.
On August 14, Universal Insurance Holdings announced that it has repurchased 241,933 shares of the company's common stock in a privately negotiated transaction with Norman Meier, the former Secretary and a former director of the company, at $7.57 per share. The repurchase price represents a discount of 10.4% from yesterday's closing price of the company's common stock.
Universal Insurance Holdings has recorded good revenue growth, and considering its compelling valuation metrics and the fact that the company is repurchasing its own shares, UVE stock can move higher. Furthermore, the very rich dividend represents a gratifying income.
Since the company is rich in cash ($4.97 a share) and has a low debt and its payout ratio is very low, there is hardly a risk that the company will reduce its dividend payment.
(Click to enlarge)

(Click to enlarge)
Chart: finviz.com
Back-testing
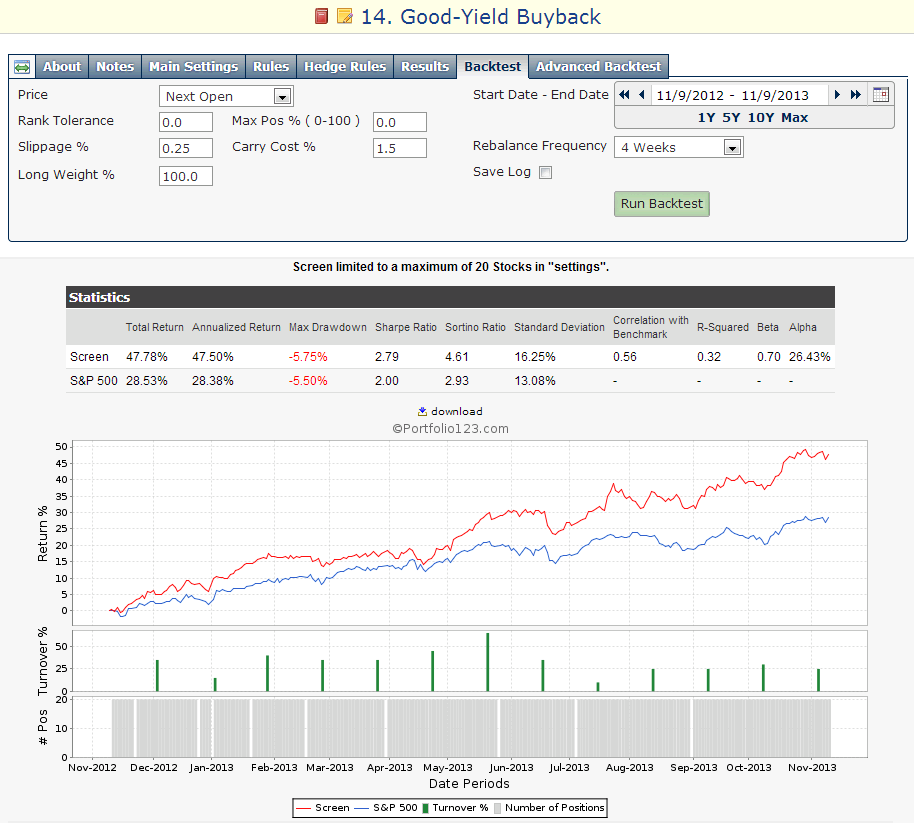
In order to find out how such a screening formula would have performed during the last year, last 5 years and last 15 years, I ran the back-tests, which are available by the Portfolio123's screener.
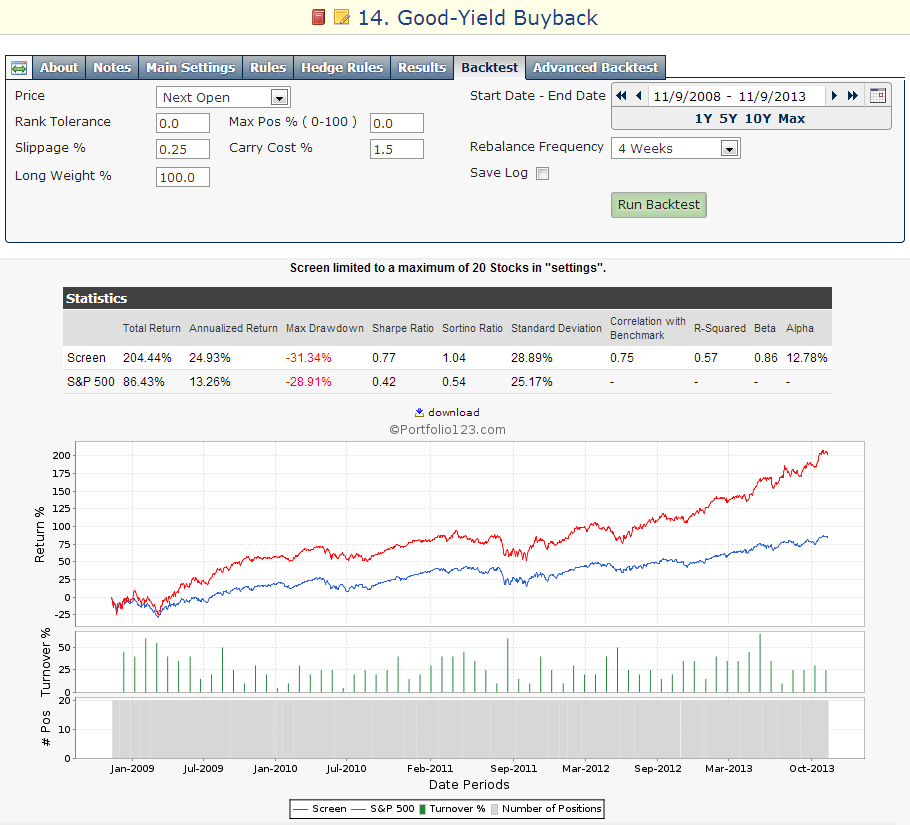
The back-test takes into account running the screen every four weeks and replacing the stocks that no longer comply with the screening requirement with other stocks that comply with the requirement. The theoretical return is calculated in comparison to the benchmark (S&P 500), considering 0.25% slippage for each trade and 1.5% annual carry cost (broker cost). The back-tests results are shown in the charts and the tables below.
Since some readers could not get the same results that I got in some of my previous posts, I am giving, in the charts below, the Portfolio123 exact codes which I used for building this screen and the back-tests. The number of stocks left after each demand can also be seen in the chart.
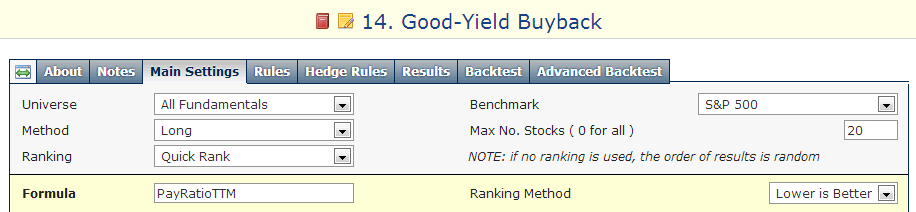
(Click to enlarge)
(Click to enlarge)
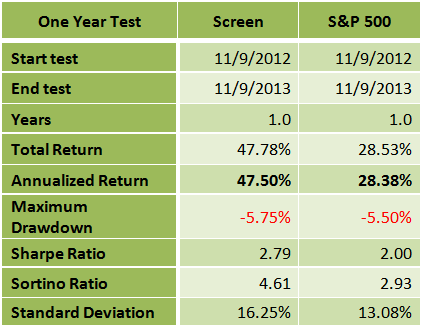
One year back-test
(Click to enlarge)
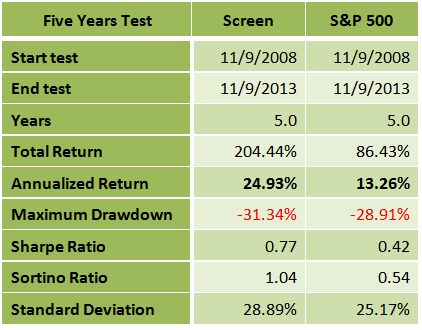
Five years back-test
(Click to enlarge)
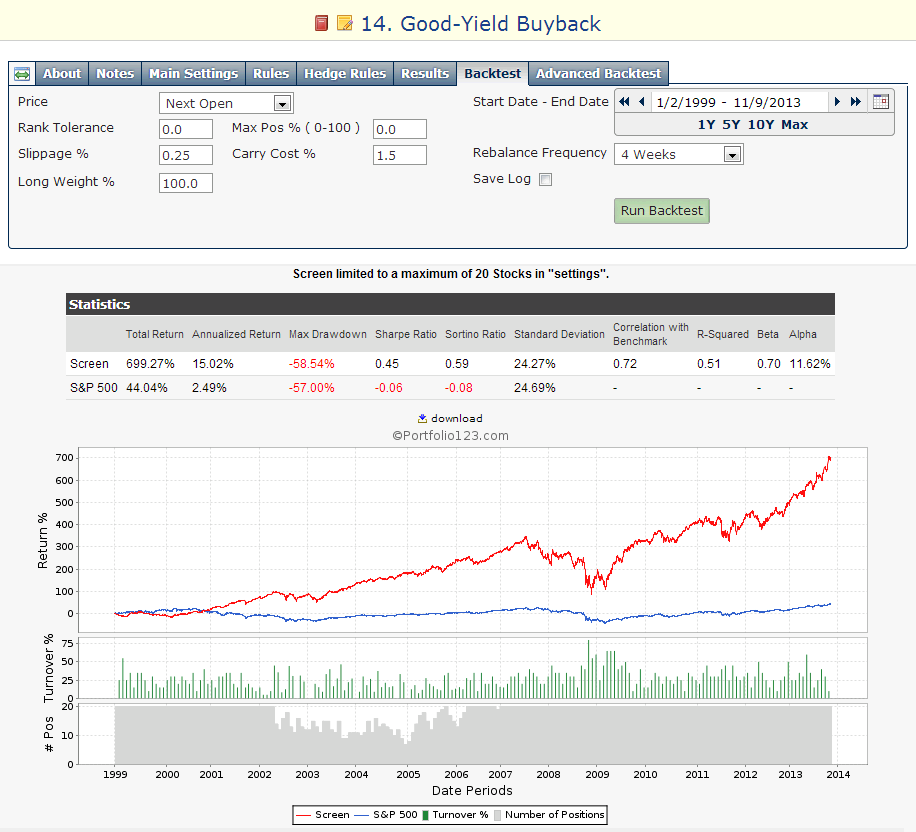
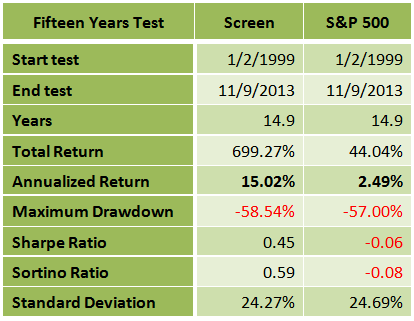
Fifteen years back-test
(Click to enlarge)
Summary
The good-yielding screen has given much better returns during the last year, the last five years and the last fifteen years than the S&P 500 benchmark. The Sharpe ratio, which measures the ratio of reward to risk, was also much better in all the three tests.
One-year return of the screen was very high at 47.50%, while the return of the S&P 500 index during the same period was at 28.38%.
The difference between the strong dividend growth screen to the benchmark was even more noticeable in the 15 years back-test. The 15-year average annual return of the screen was at 15.02%, while the average annual return of the S&P 500 index during the same period was only 2.49%. The maximum drawdown of the screen was at 58.54%, while that of the S&P 500 was at 57%.
Although this screening system has given superior results, I recommend readers use this list of stocks as a basis for further research.
In order to create a dividend stock portfolio that can outperform the market by a big margin, I have used the following screen. It is based on an attempt to search for profitable companies that pay rich dividends and that have repurchased their own shares during the last year. Those stocks would also have to show a very low debt.
Disclosure: I am long CA, UVE. I wrote this article myself, and it expresses my own opinions. I am not receiving compensation for it (other than from Seeking Alpha). I have no business relationship with any company whose stock is mentioned in this article.