I have searched for highly profitable stocks that pay rich dividends with a low payout ratio that have raised their payouts at a high rate and are currently in an uptrend. Those stocks would also have to show a low forward P/E and a very low debt.
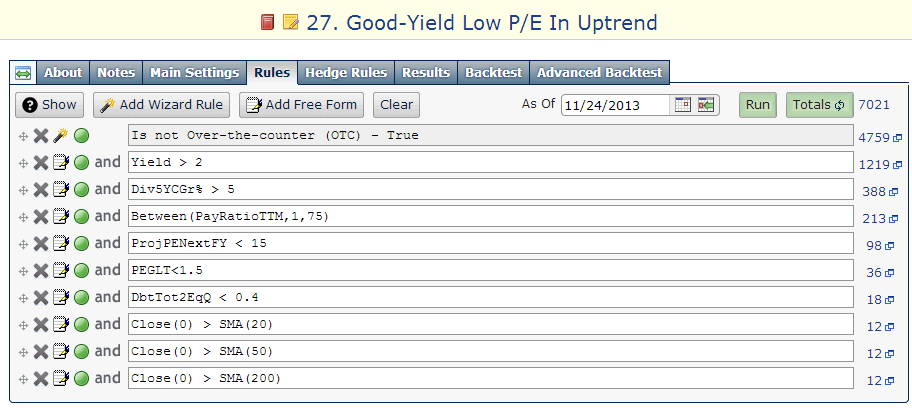
I used the Portfolio123's powerful screener to perform the search. The screen's formula requires all stocks to comply with all following demands:
- The stock does not trade over-the-counter (OTC).
- Dividend yield is greater than 2%.
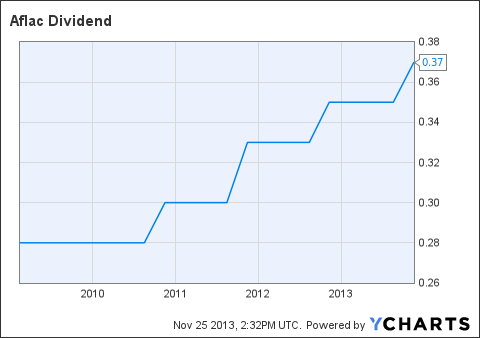
- The annual rate of dividend growth over the past five years is greater 5%.
- The payout ratio is less than 75%.
- The forward P/E is less than 15.
- The PEG ratio is less than 1.50.
- Total debt to equity is less than 0.40.
- The stock price is above the 20-day simple moving average (short-term uptrend).
- The stock price is above the 50-day simple moving average (mid-term uptrend).
- The stock price is above the 200-day simple moving average (long-term uptrend).
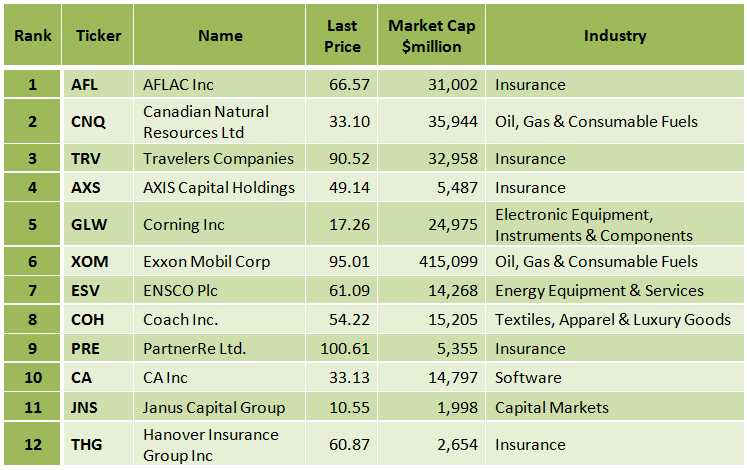
As a result, only 12 stocks came out, as shown in the charts below. In this article, I describe the first six stocks. In my opinion, these stocks can reward an investor a significant capital gain along with an income. I recommend readers to use this list of stocks as a basis for further research. All the data for this article were taken from Yahoo Finance, Portfolio123 and finviz.com, on November 25, before the market open.
(Click to enlarge)
(Click to enlarge)
AFLAC Inc. (AFL)
Aflac Incorporated, through its subsidiary, American Family Life Assurance Company of Columbus, provides supplemental health and life insurance products.
See my article from November 07, 2013.
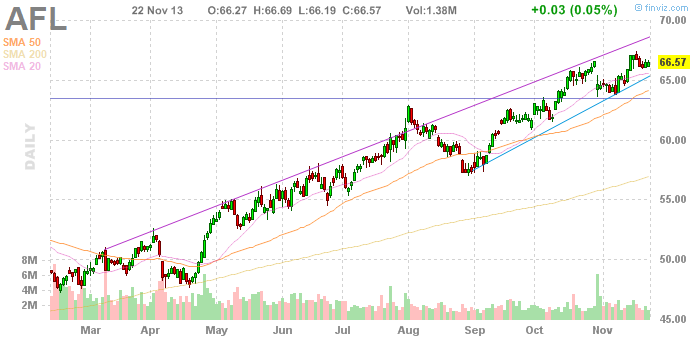
(Click to enlarge)
Chart: finviz.com
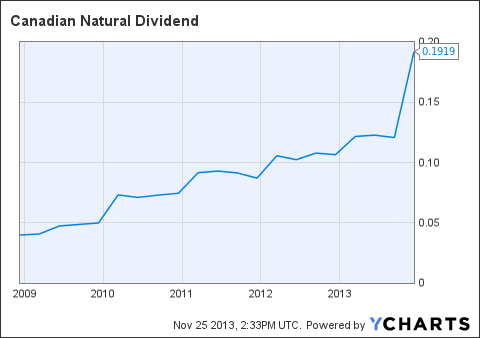
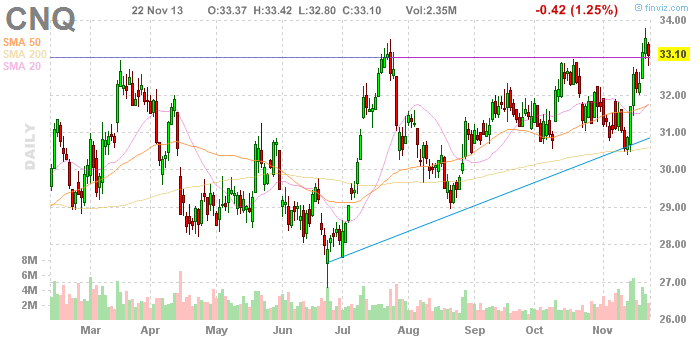
Canadian Natural Resources Limited (CNQ)
Canadian Natural Resources Limited engages in the exploration, development, production and marketing of crude oil, natural gas liquids, and natural gas.
See my article from November 20, 2013.
(Click to enlarge)
Chart: finviz.com
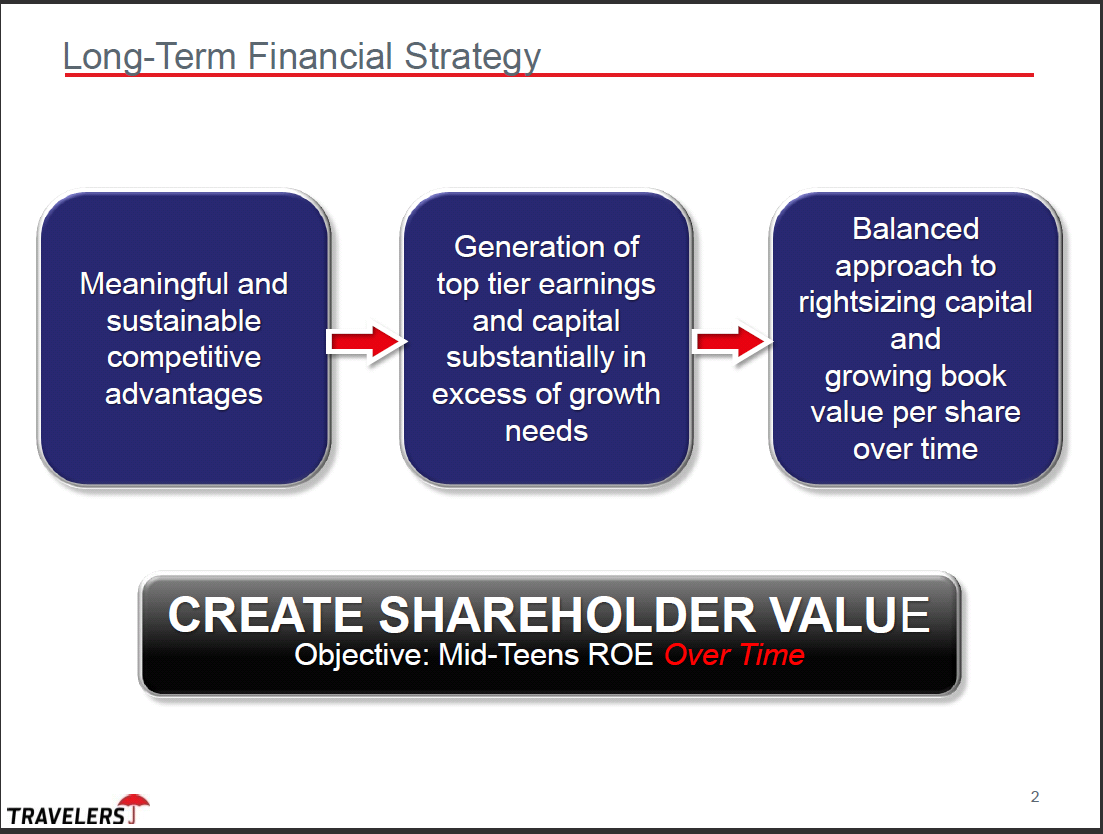
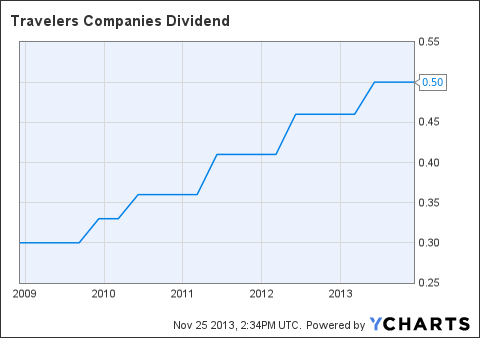
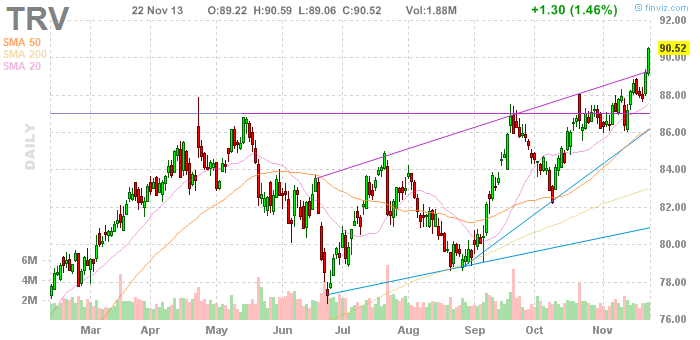
Travelers Companies Inc. (TRV)
The Travelers Companies, Inc., through its subsidiaries, provides various commercial and personal property and casualty insurance products and services to businesses, government units, associations, and individuals primarily in the United States.
(Click to enlarge)
Source: Q3 2013 Presentation
The Travelers has a very low debt (total debt to equity is only 0.26), and it has a very low trailing P/E of 11.56 and a very low forward P/E of 11.12. The price to free cash flow for the trailing 12 months is low at 12.70, and the average annual earnings growth estimates for the next five years is at 8.27%. The forward annual dividend yield is at 2.21%, and the payout ratio is only 23.7%. The annual rate of dividend growth over the past five years was quite high at 10.77%.
The TRV stock price is 3.56% above its 20-day simple moving average, 5.12% above its 50-day simple moving average and 9.09% above its 200-day simple moving average. That indicates a short-term, a mid-term and a long-term uptrend.
On October 22, The Travelers reported its third-quarter financial results, which beat EPS expectations by $0.30 and was in-line on revenues.
Third-Quarter Highlights
- Record Quarterly Operating Income per Diluted Share of $2.35, Up 6% from Prior Year Quarter.
- Return on Equity and Operating Return on Equity of 13.9% and 15.2%, Respectively.
- Strong net and operating income of $864 million and $883 million, respectively, generally consistent with the prior year quarter.
- Continued improvement in underlying underwriting margins.
- Written rate gains continued to exceed expected loss cost trends in all segments.
- Total capital returned to shareholders of $985 million in the quarter, including $800 million in share repurchases. Year-to-date total capital returned to shareholders of $1.952 billion.
- Board of Directors authorizes an additional $5.0 billion of share repurchases.
- Increase in book value per share of 1% to $68.15 and increase in adjusted book value per share of 8% to $63.87 from year-end 2012.
The Travelers has compelling valuation metrics and good earnings growth prospects, and considering its good latest quarter financial results and the fact that the stock is in an uptrend, TRV stock can move higher. Furthermore, the rich growing dividend represents a nice income.
Risks to the expected capital gain and to the dividend payment include; a downturn in the U.S. economy and extreme weather events.

(Click to enlarge)
Source: Q3 2013 Presentation
(Click to enlarge)
Chart: finviz.com
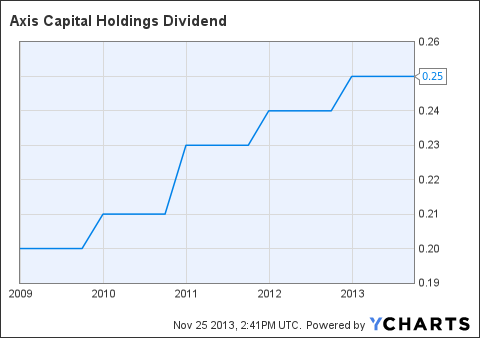
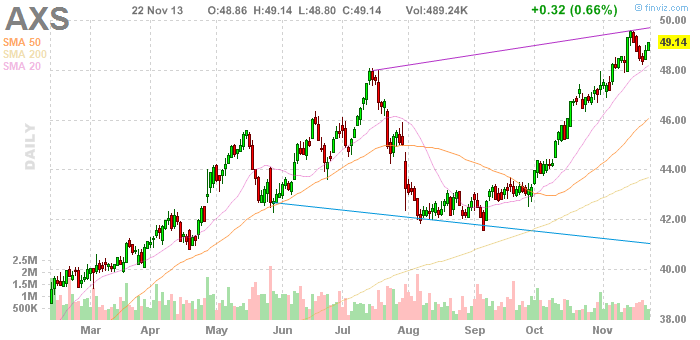
AXIS Capital Holdings Limited (AXS)
AXIS Capital Holdings Limited provides specialty lines insurance and treaty reinsurance products worldwide.
AXIS Capital has a very low debt (total debt to equity is only 0.19) and it has a very low trailing P/E of 11.62 and a very low forward P/E of 10.35. The price to free cash flow for the trailing 12 months is very low at 5.62, and the average annual earnings growth estimates for the next five years is quite high at 11.30%. The PEG ratio is low at 1.03, and the price-to-book-value is also low at 1.06. The forward annual dividend yield is at 2.04%, and the payout ratio is only 23.3%. The annual rate of dividend growth over the past five years was quite high at 6.20%.
The AXS stock price is 2.13% above its 20-day simple moving average, 6.89% above its 50-day simple moving average and 12.49% above its 200-day simple moving average. That indicates a short-term, a mid-term and a long-term uptrend.
AXIS Capital Holdings has recorded good revenue, EPS and dividend growth, during the last three years, as shown in the table below.

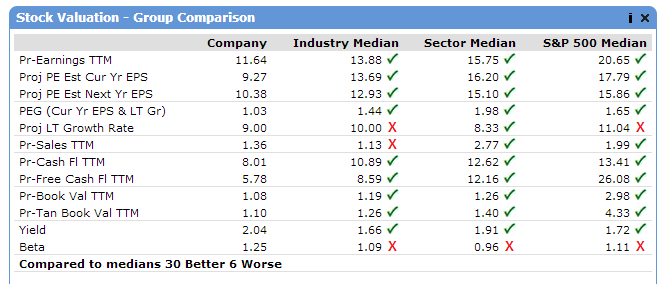
Most of AXIS Capital Holdings' stock valuation parameters have been better than its industry median, sector median and the S&P 500 median, as shown in the table below.
(Click to enlarge)
Source: Portfolio123
On October 30, AXIS Capital reported its third-quarter financial results. EPS came in at $1.74 a $0.53 better than analyst expectations.
Third-Quarter Highlights
- Gross premiums written increased 7% to $905 million, with growth of 9% in our insurance segment and 4% in our reinsurance segment;
- Net premiums written increased 10% to $716 million;
- Net premiums earned increased 10% to $945 million;
- Combined ratio of 86.3%, compared to 85.3%;
- Current accident year loss ratio of 61.5%, compared to 58.3%;
- Estimated natural catastrophe and weather-related pre-tax net losses (net of reinstatement premiums) of $51 million;
- Net favorable prior year reserve development of $80 million (benefiting the combined ratio by 8.4 points), compared with $60 million (benefiting the combined ratio by 7.0 points);
- Net investment income was comparable at $103 million;
- Pre-tax total return on cash and investments of 1.4%, compared to 2.1%;
- Net income available to common shareholders of $137 million, compared to $223 million;
- Operating income of $197 million, compared to $201 million;
- Net cash flows from operations of $432 million, compared to $424 million;
- No share repurchases during the quarter;
- Diluted book value per common share of $44.60, a 5% increase during the quarter and a 2% increase over the last 12 months; and
- A.M. Best upgraded the financial strength rating of each of our operating (re)insurance subsidiaries to a financial strength rating of A+ (Superior) in September 2013.
AXIS Capital has recorded good revenue, EPS and dividend growth, and considering its compelling valuation metrics and its good earnings growth prospects, AXS stock can move higher. Furthermore, the rich dividend represents a nice income.
Since the company is rich in cash ($9.40 a share) and has a very low debt and its payout ratio is very low, there is hardly a risk that the company will reduce its dividend payment.
Risks to the expected capital gain and to the dividend payment include a downturn in the U.S. economy, and large catastrophic and weather events around the globe.
(Click to enlarge)
(Click to enlarge)
Chart: finviz.com
Corning Inc. (GLW)
Corning Incorporated produces and sells specialty glasses, ceramics, and related materials worldwide.
See my article from November 14, 2013.

(Click to enlarge)
Chart: finviz.com
Exxon Mobil Corporation (XOM)
Exxon Mobil Corporation engages in the exploration and production of crude oil and natural gas, and manufacture of petroleum products.
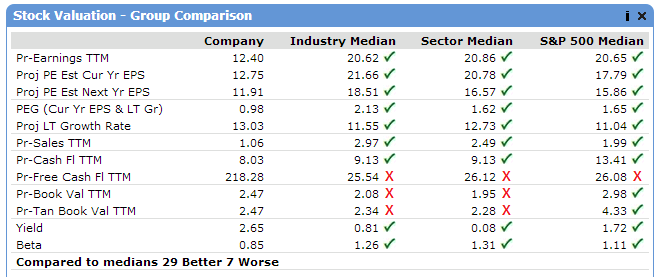
Exxon Mobil has a very low debt (total debt to equity is only 0.13) and it has a very low trailing P/E of 12.42 and a very low forward P/E of 11.94. The price-to-sales ratio is very low at 0.98. The forward annual dividend yield is at 2.65%, and the payout ratio is only 31.4%. The annual rate of dividend growth over the past five years was quite high at 9.87%.
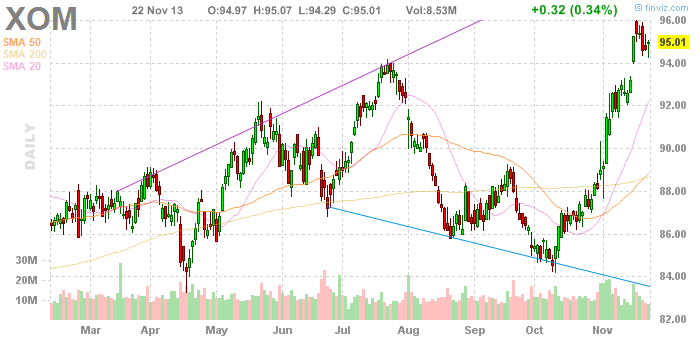
The XOM stock price is 3.45% above its 20-day simple moving average, 7.08% above its 50-day simple moving average and 7.17% above its 200-day simple moving average. That indicates a short-term, a mid-term and a long-term uptrend.
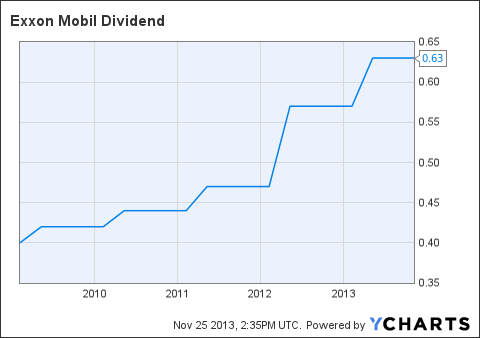
Exxon Mobil has recorded good revenue, EPS and dividend growth, during the last three years, and the last five years, as shown in the table below.

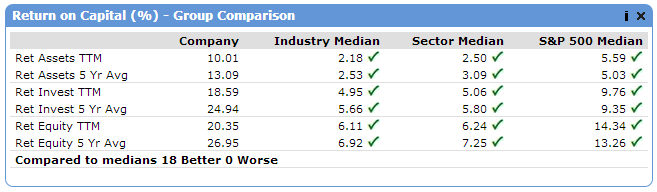
Most of Exxon Mobil's return on capital and stock valuation parameters have been better than its industry median, sector median and the S&P 500 median, as shown in the tables below.
(Click to enlarge)
(Click to enlarge)
On October 31, Exxon Mobil reported its third-quarter financial results, which beat EPS expectations by $0.02.
Third-Quarter Highlights
- Earnings of $7,870 million decreased $1,700 million or 18% from the third quarter of 2012.
- Earnings per share (assuming dilution) were $1.79, a decrease of 14% from the third quarter of 2012.
- Capital and exploration expenditures were $10.5 billion, up 15% from the third quarter of 2012, in line with anticipated spending plans.
- Oil-equivalent production increased 1.5% from the third quarter of 2012. Excluding the impacts of entitlement volumes, OPEC quota effects and divestments, production increased 2.7%, with liquids volumes up 5.3%.
- Cash flow from operations and asset sales was $13.6 billion, including proceeds associated with asset sales of $0.2 billion.
- Share purchases to reduce shares outstanding were $3 billion.
- Dividends per share of $0.63 increased 11% compared to the third quarter of 2012.
- The Esso Australia Pty Ltd operated Kipper Tuna Turrum project commenced natural gas production from the Tuna field and oil production from the Turrum field. The project is the largest domestic oil and gas development on Australia's eastern seaboard and will help secure Australia's energy future.
- As announced on August 8, 2013, Imperial Oil Limited and ExxonMobil Canada Ltd. have acquired ConocoPhillips' interest in the Clyden oil sands lease, approximately 95 miles south of Fort McMurray, Alberta. The Clyden lease contains 226,000 gross acres and is a high-quality addition to Imperial's portfolio of oil sands in-situ opportunities.
Exxon Mobil has recorded good revenue, EPS and dividend growth, and considering its compelling valuation metrics and the fact that the stock is in an uptrend, XOM stock can move higher. Furthermore, the rich dividend represents a nice income.
Risks to the expected capital gain and to the dividend payment include a downturn in the U.S. economy, and a decline in the price of oil and natural gas.
(Click to enlarge)
(Click to enlarge)
Chart: finviz.com
Disclosure: I have no positions in any stocks mentioned, and no plans to initiate any positions within the next 72 hours. I wrote this article myself, and it expresses my own opinions. I am not receiving compensation for it (other than from Seeking Alpha). I have no business relationship with any company whose stock is mentioned in this article.