A number of writers and commentators have cited Robert Shiller's CAPE or P/E10 as evidence that stocks are overvalued, relying on very long term average P/E10 as the basis for that conclusion. In his book, Irrational Exuberance, Shiller proposed the use of inflation adjusted 10 year average P/Es (P/E10 or CAPE (Cyclically Adjusted Price Earnings Ratio)) as a basis for calculating the level of the S&P 500. His website at Yale makes an updated spreadsheet of the relevant data available, going back as far as 1871. This article interprets the data in ways that suggest that the S&P 500 may be undervalued - seriously undervalued.
Choice of Time Period
First, the use of data dating back to before the period when computerized trading and availability of data created the modern high speed and well-informed market is questionable. So too is the use of data from periods of time such as the Depression years, when values were extremely low for protracted periods, or the early 1980's, when interest rates were extremely high due to Volcker's battle against inflation. With that in mind, this analysis starts in 1987, the year of the first computerized market crash.
Interest Rates
In addition, many writers opt to disregard the effect of competing investments, such as US Treasuries. Broadly speaking, the implied yields developed from PE10 should reflect a risk premium over 10 year Treasuries (GS10), so that the current rate on this ultra safe alternative needs to be factored into the equation. Dividing 1 by the P/E10 gives the implied yield, which can be compared to Treasuries.
An analysis of the data reveals that the relationship is complex and to some extent counterintuitive. Briefly, when GS10 is less than 5%, the risk premium investors demand to hold stocks increases as GS10 decreases. With GS10 above 5%, there is a preference for stocks over bonds, and the risk “premium” is in point of fact a relatively consistent negative 2%.
Here are two charts, one for GS10 0-5%, and one for GS10 5-10%, from January 1987 to the present (click to enlarge images):
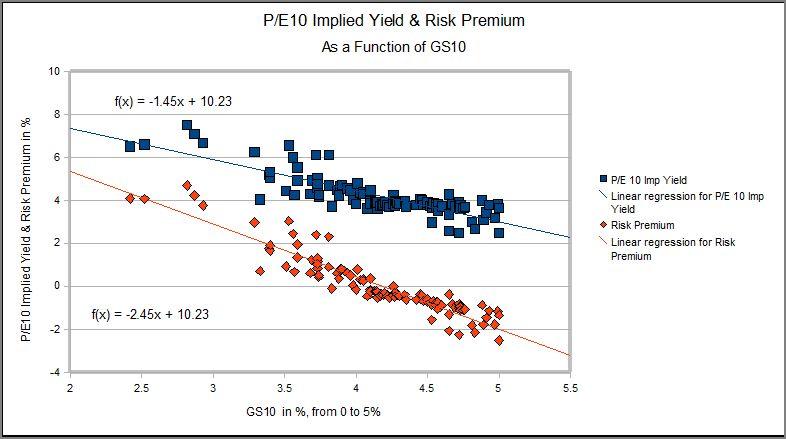

When the data is grouped as shown, the linear regressions fit well. Within the 0-5% range, it appears that risk aversion over-rules common sense. From 5% upward, stocks are preferred, because they are resistant to the inflation implied by high GS10 and offer the opportunity to participate in economic growth.
Investment Implications
This is a tipping point. If recovery continues to develop favorably, GS10 will eventually start to rise, whether driven by inflation or by increases in the Fed Funds rate. As that happens, risk premiums will reverse, leading to some very impressive P/E10s. For example, applying the linear regression formula developed in the charts above, at GS10 = 5% the P/E10 would be 36, implying S&P 1,950. If that occurs, you will hear indignant roars of pain from the bears, and joyous bellowing from the bulls.
On the other hand, if increases in GS10 are forced by bond vigilantes, or arise because of the dread stagflation, the relationships observed in the historical data might not hold true going forward.
As a practical matter, those who hold Treasuries at today's rates are going to lose money when interest rates inevitably rise, for whatever reason. Those who hold US equities, in contrast, will do extremely well if interest rates rise propelled by a recovering economy. US companies, to the extent they are better managed than the US government, will prove to be better investments.
Risk premiums are high. If and when they come down, stock P/Es will increase dramatically.
What Is Risk?
Risk can be defined as chance of loss. As used recently, it seems to be almost synonymous with Fear. Unlike Volatility, there is no distinction made between implied risk and historical risk. Historically, this country has always emerged from adversity stronger and more resilient.
Any discussion of the appropriate level of the S&P 500 at this point in time gets to be about Fear. From my perspective, the chance of loss on holding S&P 500 stocks is moderate, based on the balance sheets and recent earnings of its constituents.
A majority of US companies have strong balance sheets. Access to capital, as evidenced by Moody's Baa corporate interest rate, is favorable. These companies are increasing earnings and are located in a country where the stability of government and rule of law have made its currency a global save haven, driving down yields on its debt.
That is an important strength. If their government can borrow cheaply, it can avoid premature reductions in fiscal stimulus or excessive tax increases, allowing an economic recovery that will increase tax revenues and decrease budget deficits.
Reward
As for S&P 1,950, as developed above, if it takes four years for that to happen, it will return 15% annualized over that period. This is about risk/reward. The worst case is mediocre, another lost decade. The best case, as this data demonstrates, is well worth the risk.
Disclosure: Author is net long US equities, lightly hedged with SPY puts