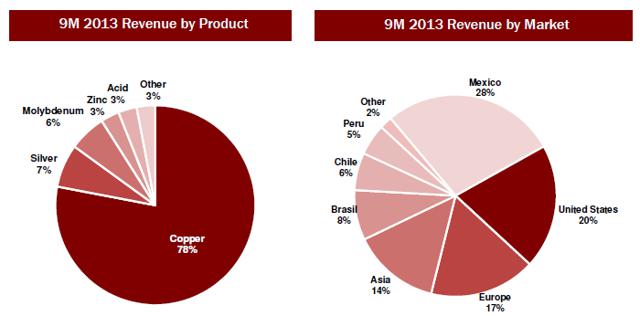
Southern Copper Corp. (NYSE:SCCO) is one of the largest copper producers in the world. The company mainly produces copper, silver, molybdenum, and zinc wherein 78% of the revenue is attributed to copper. The following pie charts show the top line distribution as per the company's products and geographical presence.
Source: Company Presentation
Southern Copper and LME Copper Spot Prices
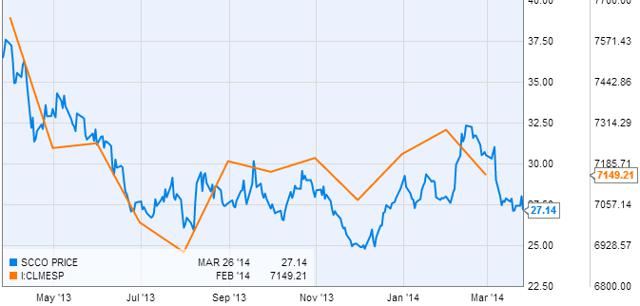
Copper producers' stock prices are generally in direct correlation with the changes in copper spot prices in the London Metal Exchange (LME). The same is the case for Southern Copper especially when 78% of the company's revenue is generated through this metal alone. Any change in LME copper prices will directly translate into the stock price of the company. Take a look at the graph below to see an example of this correlated relationship.
Source: Y-charts
This co-movement entails that any factor that impacts the LME copper spot price will also be a significant factor for Southern Copper. Copper has fluctuated a lot over the past few days; the metal dropped to a 3.5 year low the previous week (March 19th) owing to negative performance in China. Note that China represents 40% of the annual world copper consumption. Earlier this month data from China indicated that the country will probably fall short of meeting its GDP growth target of 7.5% in the current year. In February,the exports figure dropped by 18.5% despite the anticipated rise of 7.5%;the figure had risen by 10.6% in January. On the other hand, imports exceeded expectations and pushed the country to a trade deficit figure of $23 billion compared to the projection of a $14.5 billion trade surplus. Moreover, rising default risks in the country kept investors wary of any further potential setbacks after the default of a solar panel maker, Shanghai Chaori Energy Science and Technology Co Ltd, on bond payments in the beginning of March 2014. Since copper is directly related to the economic activity and since China is the biggest consumer of the metal any negative setback in the market is expected to and does have a major impact on the metal's prices.
Copper Demand
Going forward, copper prices are expected to gain momentum again on the back of recent improvements in the Chinese economy. Investors must not ignore the fact that the Chinese economy has not yet stabilized. I admit that the GDP growth has not been stellar as it was over the past few years but the economy is still growing at a rate of over 7%. Recent data reveals that copper demand in China is expected to rise by 700,000 tons in 2014 compared to the previous year's consumption level while the metal's demand is expected to rise by 100,000 tons in the developed world. However, global refined copper consumption is expected to exceed production this year. Production fell short of consumption by 193,000 tons in 2013 according to International Copper Study Group (ICSG). Refined copper sales make up 56% of the total copper sales of Southern Copper as per the 2013 annual report.
Copper Consumption is Seasonal
In addition to that, copper consumption is a seasonal concern that picks up around warmer weather as construction increases. This year, seasonality was seen in late March as opposed to early March. As the weather gets warmer going forward so will the construction and manufacturing activities and this will boost the copper demand. However, this is just an assumption based on historical trends; concrete signals are yet to be seen in this regard. This month's low manufacturing figures might lead to a further drop in the price.
Power Companies will Drive Demand
The futures of copper mirror the assumption that the LME copper spot will increase in the coming months. However, copper is struggling due to the uncertainty in China looming over its head. At the time of writing this article, the metal edged up by 0.60% to $6,549.75 per metric ton. Although China's copper demand seems to be faltering on the outside there is significant room for further investment. Energy regulators have been urged to accelerate the approval of high voltage networks and this would boost investment. Two major grid companies in the country hope to invest as much as 13% more than the previous year's investment. Given that power companies account for as much as 40% of the total copper consumption in the country these investments will boost copper consumption even if construction falls behind. However, as stated above, the prospects regarding the construction activity are positive.
Conclusion
According to my analysis, the decline of copper consumption in the manufacturing sector, if any, will be dispelled by the planned growth in the energy sector. As warmer weather progresses, the construction and manufacturing activity in both the developed and emerging countries will improve. Since Southern Copper maintains a strong positive correlation with LME, copper prices its stock price will appreciate along with the rise in market copper prices.
Besides the anticipated stock price appreciation the company generates high returns to investors internally as well in the form of dividends. With sales and prices expected to increase, the returns to the shareholders will mount.
Disclosure: I have no positions in any stocks mentioned, and no plans to initiate any positions within the next 72 hours. I wrote this article myself, and it expresses my own opinions. I am not receiving compensation for it (other than from Seeking Alpha). I have no business relationship with any company whose stock is mentioned in this article.

