In this post, we describe a stock pricing model for Cummins Inc. (NYSE:CMI). CMI is a company from Industrial Goods sector which "designs, manufactures, distributes, and services diesel and natural gas engines, and engine-related component products." The model has been estimated using our concept of stock pricing as a decomposition of a share price into a weighted sum of two consumer price indices (CPIs). The intuition is straightforward: there is a potential trade-off between a given share price and goods and services the company produces and/or provides. Cummins might be a good example of stock price dependence on the goods it produces, in the way that some energy-related companies depend on energy price.
It is not excluded that some set of consumer prices (or relevant consumer price index - CPI) drives the company's stock price. Obviously, this company competes with all other companies on the market. Therefore, the influence of the driving CPI on the company's stock price also depends on all other CPIs. To take into account the net change in various market prices, we introduce just one reference CPI as best representing the overall dynamics of the changing price environment. Hence, the pricing model has to include at least two defining CPIs. Because of possible time delays between action and reaction (the time needed for any price changes to pass through), the defining CPIs may lead the modeled price or lag behind by a few months.
The CMI monthly closing prices (adjusted for splits and dividends) were borrowed from Yahoo.com, and the relevant (seasonally not adjusted) CPI estimates through February 2014 are published by the BLS. It is worth noting that it takes approximately two weeks for the BLS to publish its estimates for the previous month. On April 5, we have the closing price for March 31, but the CPIs are available only for February. We have to update all models when new estimates are obtained for closing prices or CPIs, i.e. two times a month.
We have found that the evolution of CMI share price is defined by the consumer price index of household furnishing and operations [HFO] from the Housing CPI category and the index of motor fuel [MF] from the Transportation category. We assume that the index of motor fuel is the price driver. The defining time lags are both zero. The relevant best-fit model for CMI(t) is as follows:
CMI(t) = -8.40HFO(t-0) + 0.145MF(t-0) + 8.36(t-2000) + 1007.13, February 2014
where CMI(t) is the CMI share price in U.S. dollars, t is calendar time. Figure 1 displays the evolution of both defining indices since 2003. Figure 2 depicts the high and low monthly prices for CMI share together with the predicted and measured monthly closing prices (adjusted for dividends and splits).
The model is stable over time. Table 1 lists the best fit models, i.e. coefficients, b1 and b2, defining CPIs, time lags, the slope of time trend, c, and the free term, d, for select models for the period between September 2011 and February 2014. These models all have the same defining CPIs, time lags, and similar coefficients. All models are practically identical. Therefore, the estimated CMI model is highly reliable over time. The model residual error is shown in Figure 3. The model error has standard deviation $7.70 between July 2003 and February 2014.
The model residual shows that the current price is lower than the closing price on March 31 - $145.92. The difference between the observed and predicted prices is approximately $16, i.e. much larger than the standard error. It is not excluded that CMI price will fall in the next two months.
Table 1. Selected best fit models for the period between September 2011 and February 2014:
Month | b1 | CPI1 | lag1 | b2 | CPI2 | lag2 | c | d |
Feb-14 | -8.4012 | HFO | 0 | 0.1447 | MF | 0 | 8.3582 | 1007.132 |
Jan | -8.2407 | HFO | 0 | 0.1479 | MF | 0 | 8.2552 | 986.8984 |
Dec-13 | -8.2423 | HFO | 0 | 0.1479 | MF | 0 | 8.2541 | 987.1116 |
Nov | -8.1019 | HFO | 0 | 0.1511 | MF | 0 | 8.1572 | 969.3595 |
Oct | -8.0189 | HFO | 0 | 0.1533 | MF | 0 | 8.0896 | 958.8746 |
Sep | -7.9659 | HFO | 0 | 0.1546 | MF | 0 | 8.0441 | 952.2164 |
Aug | -7.8634 | HFO | 0 | 0.1559 | MF | 0 | 7.9723 | 939.4761 |
Jul | -7.8298 | HFO | 0 | 0.1562 | MF | 0 | 7.9494 | 935.3226 |
Dec-11 | -8.1258 | HFO | 0 | 0.1607 | MF | 0 | 8.0466 | 892.045 |
Nov | -8.2115 | HFO | 0 | 0.16 | MF | 0 | 8.1253 | 901.051 |
Oct | -8.2438 | HFO | 0 | 0.16 | MF | 0 | 8.1541 | 903.9983 |
Sep | -8.2357 | HFO | 0 | 0.16 | MF | 0 | 8.1498 | 902.3621 |
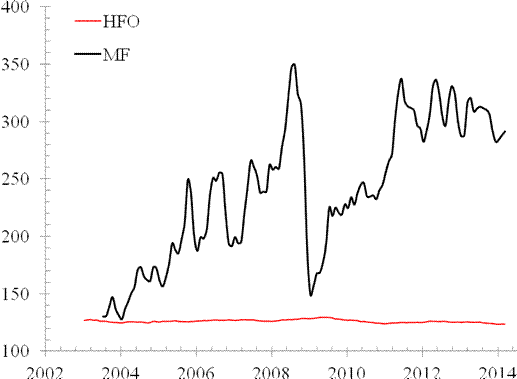
Figure 1. The evolution of HFO and MF indices:
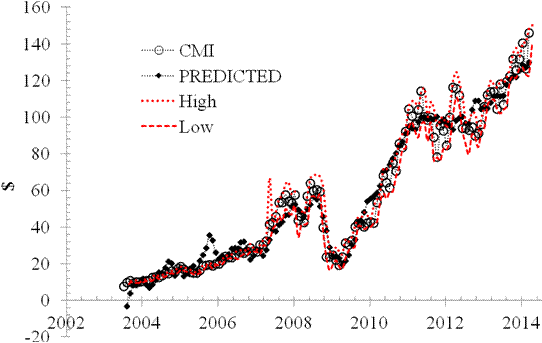
Figure 2. Observed and predicted CMI share prices:
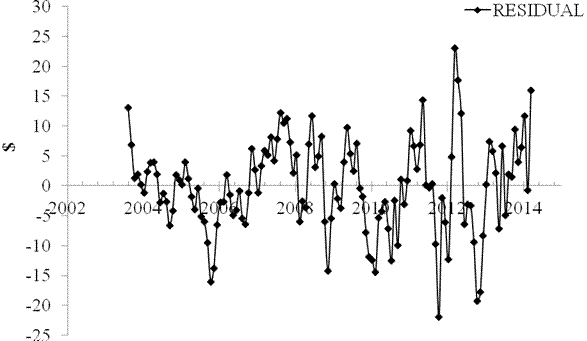
Figure 3. The model residual error: stdev=$7.70
Disclosure: I have no positions in any stocks mentioned, and no plans to initiate any positions within the next 72 hours. I wrote this article myself, and it expresses my own opinions. I am not receiving compensation for it. I have no business relationship with any company whose stock is mentioned in this article.