We have sold our small-cap exposure and reduced our high Beta/high volatility exposure, and are marginally increasing our dividend income within our equity allocation.
We are not predicting a Bear, but do believe that the risk/reward ratio in the US equity market favors a less aggressive posture than the last couple of years, based on valuation versus growth potential.
If you are far enough from the time you will call on your portfolio to support your life style, or just have more than plenty, you may not need to make any changes.
However, if you are like the majority of our clients, who currently rely on their portfolios, or are close to that stage of financial life, trying to maximize price gains at this level of market valuation is not fully prudent. Accepting a little less total return potential for more than a little downside protection is probably a good idea.
As a general rule small-cap stocks decline early and fall farther than large-cap stocks in downside scenarios. Therefore, trimming small-cap holdings seems prudent.
Within the large-cap area, these 6 "slice & dice" versions of the S&P 500 show the impact of moving to different factor driven choices, using these proxy ETFs:
- RSP - equal weighted S&P 500 stocks
- SPY - market weighted S&P 500 stocks
- SPHB - high Beta S&P 500 stocks
- SPLV - low volatility S&P 500 stocks
- SPHQ - high quality S&P 500 stocks
- SPHD - high dividend/low volatility S&P 500 stocks.
Note: This is not a recommendation to buy or sell these ETFs, but rather use of the ETFs as proxies for categories of stocks.
Figure 1 presents 3, 5 and 10 year volatility, total return, Sharpe Ratio and trailing yield; as well as Alpha, Beta and R-squared for the same periods; and the worst draw-downs for 3 months, 1 year and 3 years over the last 10 years for each approach.
Because you cannot buy the history of an index (because its composition has changed over time); and because any near-term downside event is more relevant to the current holdings of an index than to its historical holdings; and because factor ETFs generally do not have long-term histories as entities - we have used the current underlying constituents of the indexes to see how owning the current batch of stocks would have done over 3, 5 and 10 years.
In a subsequent article, we will scenario stress test those same portfolios.
Figure 1:
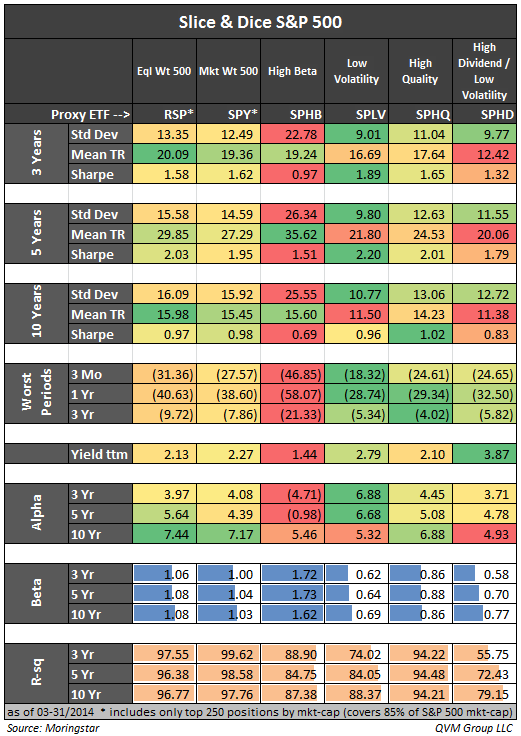
RSP: In RSP, we see that the tilt away from the largest stocks has produced a somewhat higher return over the last 3, 5 and 10 years; but with higher volatility, and slightly larger draw-downs, and somewhat lower yield and Alpha.
The RSP comparison would probably be more severe if we could have used all 500 stocks, but due to a limit of 250 stocks in our portfolio analysis software, we used only the largest 250 stocks (which were also used for SPY). 250 stocks in the S&P 500 covers 85% of its market-cap.
SPHB: The simple red-yellow-green shading in the table, shows that while high Beta stocks were advantageous over the past 5 years, they were not so versus the S&P 500 over 3 and 10 years; and generated more volatility, less Sharpe, larger draw-downs and negative or less Alpha; and the lowest yield.
SPLV: Low volatility does very well on volatility (no surprise there), but with good Sharpe Ratios; with "mild" worst draw-downs, solid yield, and good Alpha.
SPHQ: High quality is slightly less volatile than the S&P 500 with slightly lower total return, comparable Sharpe's and slightly lower yield; with comparable Alpha, and better worst draw-downs.
SPHD: High dividend with lower volatility trails the other choices in terms of total return for all periods, with lower Alpha, middle of the pack worst draw-downs, better than average volatility, but less than average Sharpe Ratios.
Its major strong point is the percentage of total return from dividends is much higher than the other choices - making it a "bird in the hand versus two in the bush" choice.
For those who are drawing on their portfolios, the relative stability of dividends versus price returns may reduce the "risk of ruin" (outliving assets) for those whose draw rate is close to the yield rate.
Figure 2 shows valuation metrics for the ETFs themselves.
On a price to cash flow basis, high dividend/low volatility is least expensive, but most expensive on a price to earnings basis, and highest in yield.
High Beta is second least expensive on a price to cash flow basis, and least expensive on a price to earnings basis, and lowest in yield.
Low volatility has an across the board middle ranking.
Figure 2:
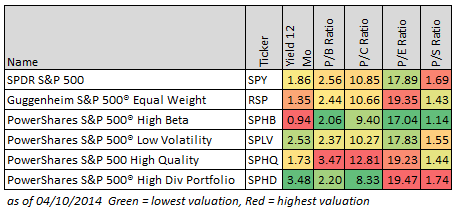
Figure 3 shows the sector composition of the several ETF choices.
The sectors are divided between those that are strongly impacted by economic conditions (cyclical), moderately impacted (sensitive) and relatively mildly impacted (defensive).
High Beta is most exposed to cyclical stocks, and minimally exposed to defensive stocks.
Low volatility and the high dividend/low volatility categories are most defensive, but heavily exposed to utilities, which may have more interest rate sensitivity than healthcare and consumer defensive stocks.
High quality is also heavily defensive, but much less exposed to utilities, and much more exposed to consumer defensive stocks.
Figure 3:
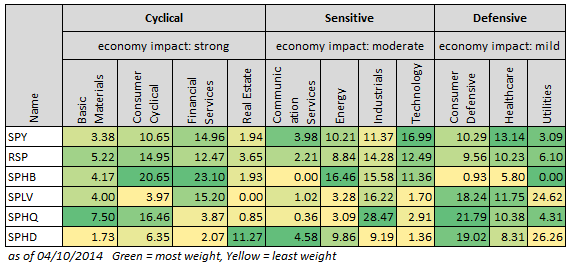
Figure 4 shows the total return the "Street" expects over the next 12 months, composed of the sum of the projected price return and the current yield.
The projected price return was calculated by weighting the average Street price projection for each individual stock in each ETF (in this case all 500 in SPY and RSP) and summing the weighted average price returns.
In a recent article we did the same for the 10 sectors used by Standard & Poor's for the S&P 500.
High Beta has the highest projected return at 12.08%, and high dividend has the lowest at 5.26%.
Low volatility is near the bottom at 5.92%, then high quality at 6.92%, then equal weight at 8.46% and market-weighted 500 at 9.59%.
Our concern, however, is that Street projections have a hefty element of trend extrapolation, and not enough of valuation limitation or macro evaluation to be fully reliable.
Figure 4:
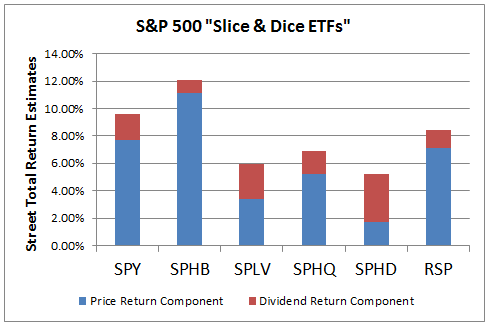
Figure 5 presents the same data as Figure 4, but in a 100% "common size" format to make the price return versus dividend return trade-off more clear.
Remember that the dividend return is significantly more reliable than the price return in projections.
Figure 5:
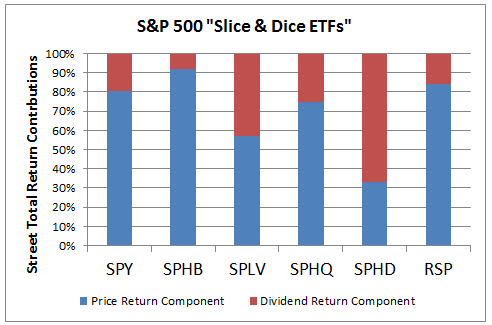
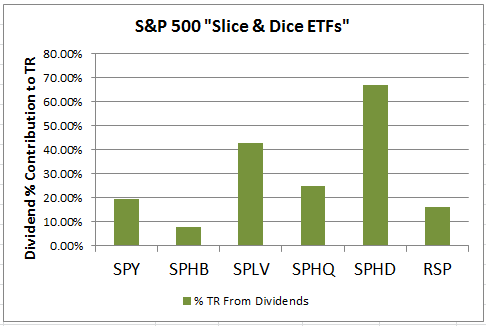
Figure 6 presents the dividend component of return by itself, and expresses the percentage of total return expected to come from dividends.
Figure 6:
Common Holdings of SPLV, SPHQ and SPHD:
There are 12 stocks held in common by the low volatility, high quality and high divided ETFs. They deserve further consideration. We will do that in a subsequent article.
| (LMT) | Lockheed Martin |
| (KMB) | Kimberly-Clark |
| (BAX) | Baxter International |
| (RSG) | Republic Services |
| (WM) | Waste Management |
| (PAYX) | Paychex |
| (MO) | Altria Group |
| (CVX) | Chevron |
| (SO) | Southern Company |
| (JNJ) | Johnson & Johnson |
| (K) | Kellogg |
| (MCD) | McDonald's |
We all have to make our own trade-off choices here, and those are quite different from investor to investor, based on factors such as life expectancy, level of wealth accumulation and sufficiency, emotional and financial limits on portfolio value fluctuation, and other factors.
We hope this is helpful to those of you evaluating standing on your current equity posture versus some reconfiguration at this time.
We will provide scenario stress tests on these portfolios in a subsequent article.
Disclosure: QVM has positions in SPY, LMT, BAX, CVX and JNJ as of the creation date of this article (April 11, 2104). We certify that except as cited herein, this is our work product. We received no compensation or other inducement from any party to produce this article, and are not compensated by Seeking Alpha in any way relating to this article.
General Disclaimer: This article provides opinions and information, but does not contain recommendations or personal investment advice to any specific person for any particular purpose. Do your own research or obtain suitable personal advice. You are responsible for your own investment decisions. This article is presented subject to our full disclaimer found on the QVM site available here.