Share price of Frontier Communications (FTR) has risen by 46% over the past 12 months, largely outpacing a 20% return for S&P 500 Index. In my view, the price appreciation has gone a bit far. Dividend prospects look healthy in near term, suggesting existing shareholder should continue holding the stock due to the attractive income. However, as current valuation has baked in somewhat aggressive long-term assumptions, potential investors are recommended to wait for a lower entry price.
FTR's has recently demonstrated some progress towards stabilizing its declining revenue. Broadband momentum continued in Q4 2013 as the company added additional 28K subscriptions, which exceeded consensus expectation (at ~23K) thanks to simplified broadband pricing. Management expects the solid performance to persist in 2014 through continued market share gain and expansion of sales channels. Despite the positive broadband results, FTR's voice business saw continued loss in the quarter. In an effort to tackle the voice decline, FTR announced a $2B acquisition of AT&T's (T) wire line operations in Connecticut and the deal is expected to be cash flow accretive.
Based on management's financial guidance for 2014, I have performed a free cash flow projections from 2015 to 2016 to gauge FTR's dividend capacity. Given that FTR's EBITDA to operating cash flow ("OCF") conversion ratio has been trending within a tight range between 65% and 68% over the past 5 years, the company's EBITDA represents a good proxy for OCF and thus my analysis started with consensus EBITDA estimates. To be conservative, I applied a haircut in a range between 2.5% and 5.0% on the consensus EBITDA estimates. I then assumed OCF conversion to remain flat at 65.0% (at the low end of its 5-year historical range). I assumed FTR to incur $700M capex in 2014, which is a bit higher than management guidance ($600M capex plus $90M capex for integration of AT&T's wire line operations). The capex for 2015 and 2016 was projected to be at the same level. Based on those assumptions, I calculated a free cash flow ("FCF") range between $670M and $690M over the forecast period. It is noted my calculated free cash flow of $679M for 2013 is below the mid-point ($750M) of management's guidance range in between $725M and $775M. Even with the conservative inputs, FTR has sufficient free cash flow to cover its current dividend commitment at $0.10/share per quarter or $400M per annum, and the company can even grow its dividend by 5% per annum over the forecast period and still has more than $200M cash surplus in each year, suggesting solid dividend security over a near term (see chart below).

Although FTR has demonstrated some progress with its broadband business, the company still faces challenges in stabilizing its revenue over a long term due to secular declining trends for its wire line business and regulatory revenue. However, the stock's current valuation has reflected some optimistic long-term assumptions.
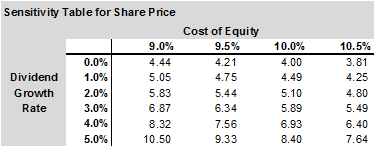
Based on Gordon growth dividend discount model, a cost of equity in a range between 9% and 10%, and annualized dividend of $0.40, the current share price of $5.89 reflects a perpetual dividend growth rate of 2-3% (see chart below). While I believe the company has solid capacity to grow dividend over a near term, long-term dividend growth prospects remain questionable as it is still not clear whether FTR can overcome secular pressures. Hence, the 2-3% perpetual dividend growth embedded in the current share price seems a bit high in my opinion.
Further, I have also performed a DCF analysis to estimate some key assumptions that are baked in the current share price. The following assumptions are used in the model (see chart below):
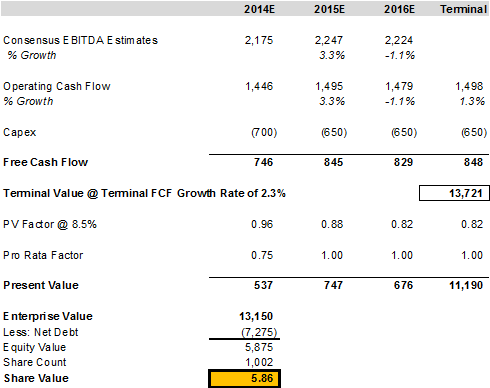
- Consensus EBITDA estimates from 2014 to 2016 (without any haircut discounts);
- OCF conversion rate of 67% that is consistent with its 5-year historical average;
- OCF of $1.5B in terminal year based on a 1.3% growth rate from the estimated OCF in 2016;
- Capex projections ranging from $650M to $700M over the forecast period that are in line with management's guidance for 2014; and
- Terminal value calculated based on Gordon growth FCF model which are based on 2.3% FCF growth rate in terminal year and an 8.5% WACC;
The above inputs would result in a share value of $5.86 which is close to the current share price. I have noted two somewhat aggressive assumptions here - the 1.3% OCF growth rate and 2.3% FCF growth rate in terminal year. Due to the same reasons discussed earlier, assumptions for perpetual growth in FCF would look optimistic to me.
Another sign suggesting a stretched valuation would be FTR's current dividend yield. According to the chart shown below, FTR's dividend yield averaged at 9.5% in the past 10 years and rarely dropped below 7.0%, which appears to be a technical floor. The stock's dividend yield now stands at 6.8%, and it is near CenturyLink's (CLT) 6.3% and way below Windstream's (WIN) 11.3%.

In conclusion, as FTR's dividend prospects remain secure over a near term, existing shareholders (especially those with low cost base) should continue to hold the shares and collect the quarterly income. For potential buyers, I recommend to stay on the sidelines due to the stretched valuation and wait for a lower entry price.
All charts are created by the author, and data used in the article and the charts is sourced from S&P Capital IQ, unless otherwise specified
Disclosure: I am long FTR. I wrote this article myself, and it expresses my own opinions. I am not receiving compensation for it (other than from Seeking Alpha). I have no business relationship with any company whose stock is mentioned in this article.