Last year at this time, I wrote Caterpillar: 15% Dividend Increase Makes It a Buy. This year Caterpillar (NYSE:CAT) went 2% better with a 17% dividend increase to $0.70/quarter. I have dripped this stock since 2012 and note that it is a cyclical dividend growth stock, which indicates the strength of the industrial sector in the economy. The economy has been weak over the past decade and I wonder if we are pulling out of recession. Therefore, I ran a five-year dividend growth study to see how Caterpillar has performed as an investment. Being a retiree since 2000, with extended family obligations, it is crucial that all of my investments perform to the best of their abilities. Reliability of a dividend payment as well as reliability of a dividend increase is important to me. Caterpillar is a Dividend Contender with 21 years of consecutive dividend increases (data from dripinvesting.org). I calculate the 5-year dividend growth rate to be 10.7% and the current yield to be 2.59%. Therefore, my 5-yr TweedFactor (sum of yield + 5-year dividend growth rate) is 13.29 (below the current P/E of 18.45). However, looking at the past two years, it appears that CAT has increased its rate of dividend growth. Looking at a one-year TweedFactor, I calculate 19.59, which I compare to projected earnings for 2015 of $7.16 for a forward P/E of 15.11.
I ran a spreadsheet over the last five years to see what an investment would have done starting in April 2009. I run these spreadsheets on any proposed investment to verify drip returns:
| Date of reinvest | Div Rate | # Shares | Dividend | Drip price | # Shares pur | Total Value | Current Yield |
| $0.70 | 350.05 | $3,354.94 | $102.93 | 44.34 | 2.72% | ||
| 04/16/14 | $0.60 | 348.02 | $208.81 | $102.93 | 2.03 | $36,030.76 | 2.33% |
| 01/16/14 | $0.60 | 345.77 | $207.46 | $92.01 | 2.25 | $32,021.54 | 2.61% |
| 10/17/13 | $0.60 | 343.37 | $206.02 | $85.85 | 2.40 | $29,684.15 | 2.80% |
| 07/18/13 | $0.60 | 340.98 | $204.59 | $85.72 | 2.39 | $29,433.49 | 2.80% |
| 04/18/13 | $0.52 | 338.79 | $176.17 | $80.46 | 2.19 | $27,435.34 | 2.59% |
| 12/20/12 | $0.52 | 336.83 | $175.15 | $89.50 | 1.96 | $30,321.85 | 2.32% |
| 10/18/12 | $0.52 | 334.82 | $174.11 | $86.62 | 2.01 | $29,176.61 | 2.40% |
| 07/18/12 | $0.52 | 332.73 | $173.02 | $82.52 | 2.10 | $27,629.72 | 2.52% |
| 04/19/12 | $0.46 | 331.31 | $152.40 | $107.36 | 1.42 | $35,721.66 | 1.71% |
| 10/18/12 | $0.46 | 329.85 | $151.73 | $104.26 | 1.46 | $34,542.20 | 1.76% |
| 10/20/11 | $0.46 | 328.06 | $150.91 | $84.26 | 1.79 | $27,793.41 | 2.18% |
| 07/18/11 | $0.46 | 326.67 | $150.27 | $107.80 | 1.39 | $35,365.08 | 1.71% |
| 04/20/11 | $0.44 | 325.35 | $143.15 | $108.28 | 1.32 | $35,371.62 | 1.63% |
| 01/18/11 | $0.44 | 323.87 | $142.50 | $96.23 | 1.48 | $31,308.04 | 1.83% |
| 10/21/10 | $0.44 | 322.07 | $141.71 | $78.89 | 1.80 | $25,549.72 | 2.23% |
| 07/16/10 | $0.44 | 319.87 | $140.74 | $63.94 | 2.20 | $20,593.08 | 2.75% |
| 04/22/10 | $0.42 | 317.89 | $133.51 | $67.51 | 1.98 | $21,594.27 | 2.49% |
| 01/15/10 | $0.42 | 315.68 | $132.59 | $60.12 | 2.21 | $19,111.55 | 2.79% |
| 10/22/09 | $0.42 | 313.44 | $131.65 | $58.74 | 2.24 | $18,543.31 | 2.86% |
| 07/16/09 | $0.42 | 309.64 | $130.05 | $34.15 | 3.81 | $10,704.09 | 4.92% |
| 04/16/09 | $0.42 | 305.71 | $128.40 | $32.71 | 3.93 | $10,128.17 | 5.14% |
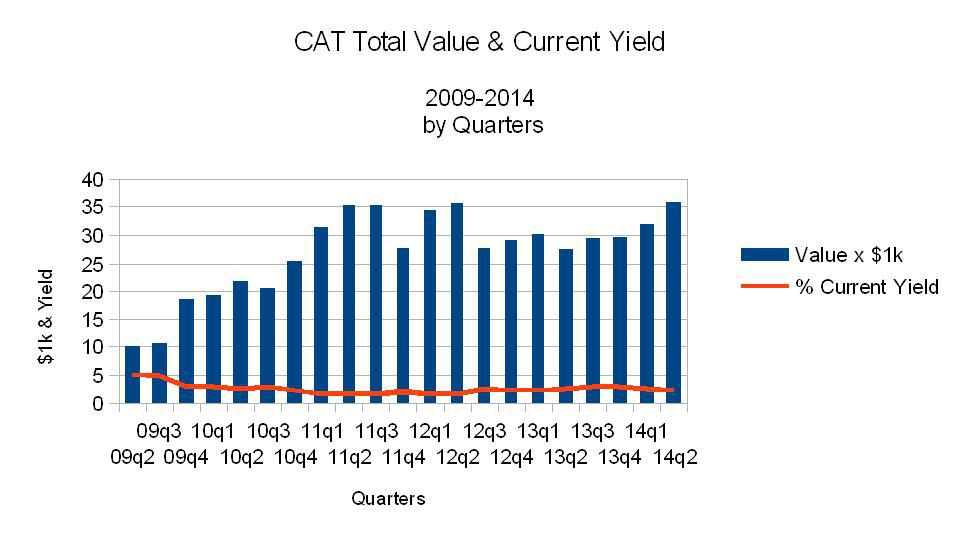
I have graphed the above spreadsheet: I note that $10,000 invested on 04/16/2009 returned $40,594.78 as of 04/16/2014. I pay special attention to the current yield in order to see when to make strategic purchases. From the table, it appears that a 5.14% yield was available in April 2009. This was close to the bottom of the Great Recession and I was unable to buy at that time. However, I note several instances of 2.86%-2.5% yields, which appear to be low points in price. For those who trade dividend growth stocks, I note low yield points between 1.83% and 1.71%, which would be good selling points. I buy and hold dividend growth stocks until I'm forced to sell for family expenditures. I also note that CAT is up 21.81% so far this year including dividends reinvested in my account.
Conclusion: Caterpillar is a cyclical dividend growth stock, which I drip in order to capture additional growth due to reinvested dividends. It also is a strong indicator of the strength of the economy and can grow rapidly once there is perception of growing global demand. However, it falls with the business cycle. If I traded this stock, I would buy at a 3% yield and sell at a 1.7% yield. I am pleased to simply buy and drip. One should be broadly diversified in all the (SPY) sectors and this is one of my industrial sector stocks. One should do their own due diligence on any asset purchase making sure they can handle the ups and downs of the market.
Disclosure: The author is long CAT, SPY. The author wrote this article themselves, and it expresses their own opinions. The author is not receiving compensation for it. The author has no business relationship with any company whose stock is mentioned in this article.