Sales of the Arena Pharmaceuticals' (ARNA) weight loss drug, Belviq, were down slightly this week, after seeing a nice recovery last week. While the issue of weight loss is ongoing, there is a seasonality to the sector that has developed a pattern over the years. The first half of the year always seems to be the strongest in terms of sales, and with the calendar now saying June, we could be getting into that segment where sales lighten up.
Thus, while a flattening of sales is in many ways expected, we should still be seeing growth happen in the weeks ahead, in particular because Eisai has stated that it is "re-launching" Belviq in July with an additional 200 sales reps. If the re-launch is a success, it could help soften the edges of the seasonality within the space.
This week, IMS Health showed that Belviq sales were down by a bit over 2% to just above 9,700 un-adjusted. My adjustment has sales at just over 10,200. Symphony Health shows scripts at a bit over 12,000. I have long suspected that the delta between the two is the 15-day free trials, which are actually half of a bottle instead of a whole bottle. Personally, I have found that the IMS numbers more accurately relate to the financial data and bottles shipped data that Arena provides in quarterly calls. I use IMS as the baseline in all of my charts, and provide Symphony as a courtesy. If a reader prefers Symphony data, you will need to adjust the average revenue per prescription downward from the numbers provided by Arena and Eisai, which both use IMS.
The sales this week are still tracking in lock-step with the $100 million gross sales graph I created earlier this year. The orange line, which represents adjusted IMS Health sales figures, is nearly invisible on the chart below, because the tracking is so close to the green $100-million line. While the chart still reflects a sales pace for $100 million, I feel it is quite likely that sales can challenge $125 million.
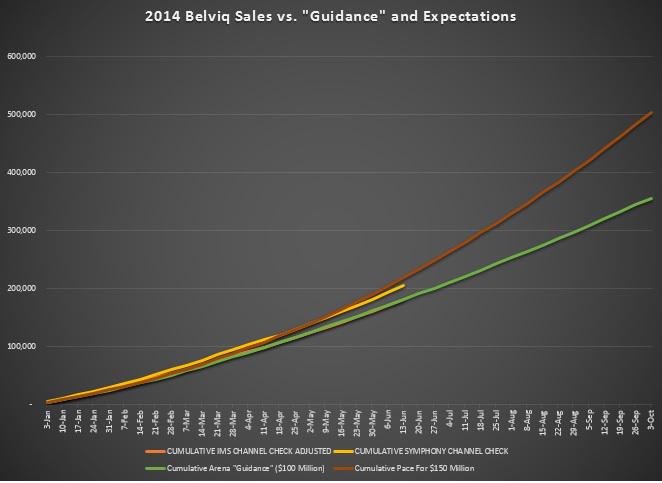
(Chart Source - Spencer Osborne)
The ultimate purpose in tracking script sales is to assess what is needed in order to reach certain financial goals. For many months, there have been readers that model a flat percentage growth rate (i.e. 2.5% or 3% or 4%) and project it over a long period of time, ultimately getting to what appears to be some lofty and impressive numbers. What we need to consider is that a) that type of growth rarely exists, b) it is harder to grow by a set percentage as the base number increases, c) there will be weeks where positive growth is stunted by a holiday, d) seasonality, and e) what I term as "churn" (people coming off of the drug for one reason or another). The chart below outlines the script pace to $100 million in sales and the script pace to $150 million.
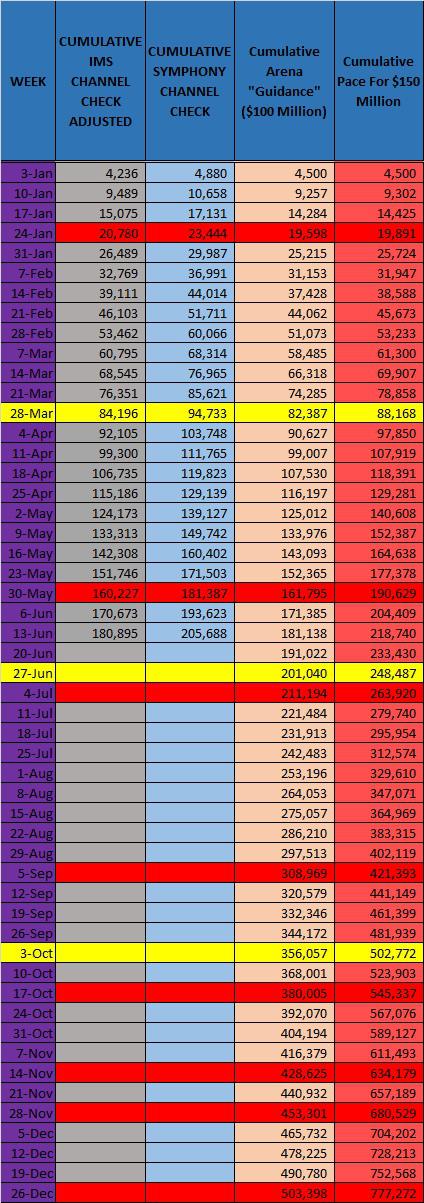
(Chart Source - Spencer Osborne)
In looking at the data, you can see that approaching the half-way point, my adjusted IMS Health script totals are at about 181,000. To reach $100 million as a minimum target, we need to see about 500,000 scripts. That should give investors perspective. My opinion on this is pretty simple. If the pace is $100 million in gross sales, it is neutral-to-slightly positive for the equity. If the pace is $125 million in gross sales, the equity should be able to get to $8 per share as a foundation. A pace to $150 million could set a foundation at $10 per share. Later in the article, you will see scripts boiled down to dollars. The current annualized rate this week remained above $100 million, which is positive.
Looking at quarter-over-quarter performance, we can see that the current quarter is progressing strongly even with a slight dip this week. The second quarter of this year has demonstrated a steeper sales trajectory than any quarter prior. That is likely a direct result of marketing efforts, insurance coverage improvements, and more awareness. Beginning next quarter, we will actually be able to assess year-over-year metrics. So far, Q2 is 45% higher in script sales than Q1. This past week was 38% better than the corresponding week last quarter.
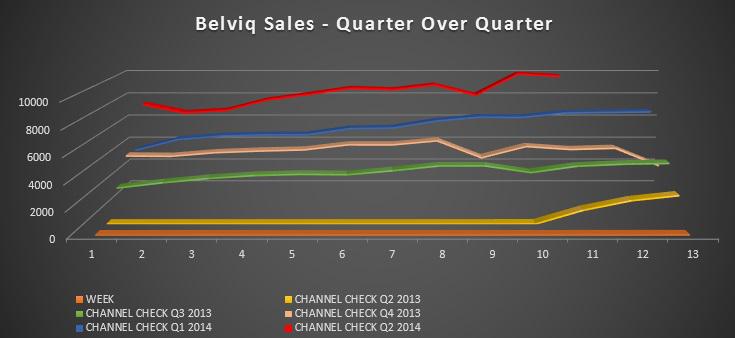
(Chart Source - Spencer Osborne)
Getting to revenue is the important aspect of all of this. Even with regular updates, there still seems to be confusion among investors about revenue. For those that understand, I ask for a moment of patience. Gross revenue is essentially the amount of money collected by Eisai from warehouses, distributors, pharmacies, etc. Eisai set the price of Belviq at $199.50 per bottle. This is the number that generates the gross sales number in the charts. Net revenue is what is left after certain expenses are accounted for. Typically, net revenue has been between 50% and 60% of gross revenue. For simplicity, I use 55%. Arena revenue is a percentage of net revenue. In the case of Belviq, that number is currently 31.5%. When I refer to gross sales, it is the metric that would be used to determine blockbuster status ($1 billion of gross sales in 1 year) or what sales volume a drug does. Thus, if Belviq sales were $100 million this year, the net sales number would be about $55 million. The Arena share of net revenue would be about $17 million.
The chart below looks at gross, net, and the Arena share of revenue. As you can see, gross sales this week were about $2 million, while year-to-date, gross sales stand at $36 million. Net sales this week were about $1.1 million. The Arena share of net sales was about $353,000. Taking it a step further, we are currently at $36 million, and need to see $64 million in sales over the remainder of the year to get to $100 million.
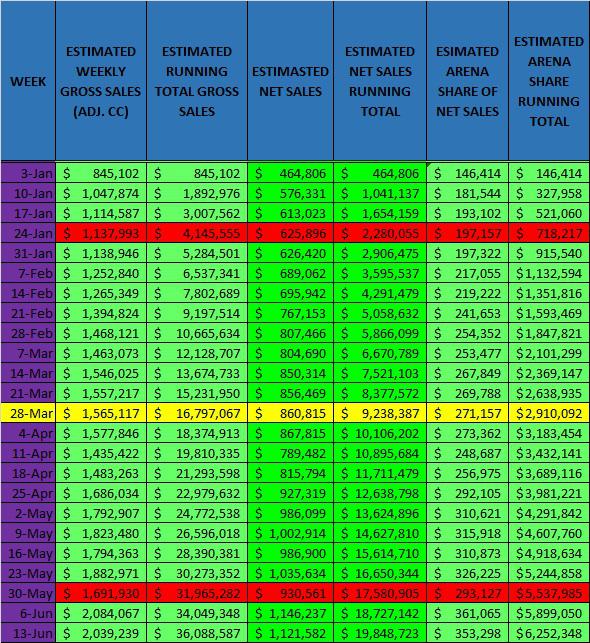
(Chart Source - Spencer Osborne)
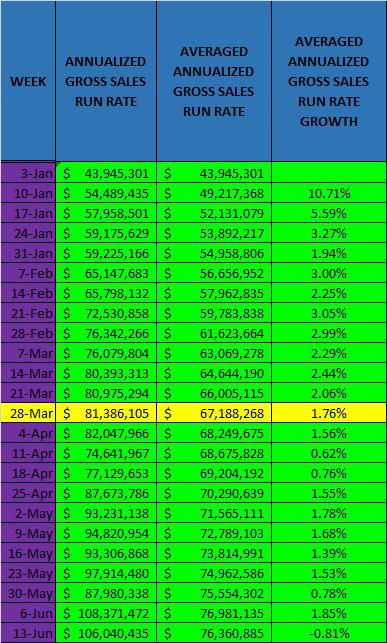
Drilling down the detail a bit further, we get into projecting. This is where the annualized rate comes into play. Over the last two weeks of script sales, the annualized rate is over $100 million. Simply stated, the current sales pace over a period of 52 weeks would generate a specific amount of gross sales. What we want to see is growth in the annualized rate, because it helps to set a baseline for what should happen at a minimum over the next 12 months. I caution you to be careful and not confuse the annualized rate with the calendar year. The annualized sales rate is $106 million. The average annualized rate this year is $76 million.
(Chart Source - Spencer Osborne)
I have stated that the Street is seeking an inflection point that demonstrates that sales will be above $100 million. The tracking has not yet demonstrated that on the chart, but the last few weeks have delivered numbers that could be looked at as enough, considering reasonable growth and a good re-launch, to tip the scale to a $125-million pace.
If the early signs are there that sales can indeed get to $125 million, what is the Street waiting for? The headwinds are the seasonality, what happens with re-launch, and the fact that the remainder of the year has the major holidays that will impact the growth. If the re-launch is successful, it will remove one cloud from the equation. Shy of that, it will take a clear and present inflection to give the Street a boost in confidence. That is where many seem to get lost when I say that it will take a few 10% week-over-week gains to move the equity. In simple terms, what the Street is looking for is a crystal clear path to certain sales figures. Until we get that demonstrated, there will be challenges with modest growth numbers. In the meantime, readers here can be a bit ahead of the curve and seize what could be a great buying opportunity. Stay Tuned!
Disclosure: The author is long ARNA. The author wrote this article themselves, and it expresses their own opinions. The author is not receiving compensation for it (other than from Seeking Alpha). The author has no business relationship with any company whose stock is mentioned in this article.