 Here's a weekend snapshot of major world indexes. The table at right shows the performance over the past week.
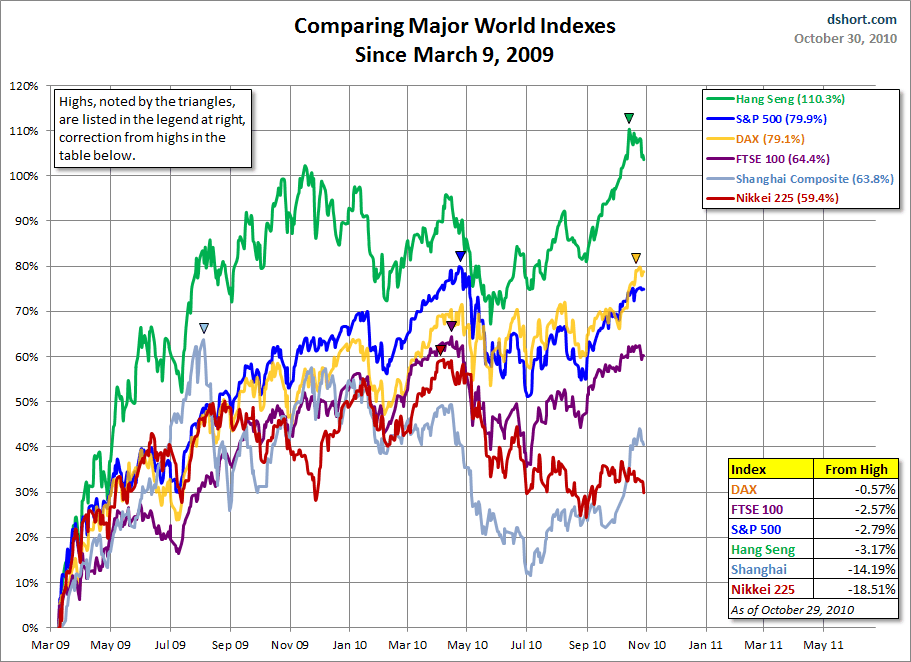
The Nikkei 225 was the worst performer in a generally bad week for major world markets. The Hang Seng also saw some additional profit taking from its mid-month high. The top-performing Shanghai Composite was a fractional gainer, and the S&P 500 was at break-even.
The chart below illustrates the comparative performance of World Markets since March 9, 2009. The start date is arbitrary: The S&P 500 hit a low on March 9th, the Nikkei 225 on March 10th, the DAX on March 6th, the FTSE on March 3rd, the Shanghai Composite on November 4, 2008, and the Hang Seng 4.4 months earlier on October 27, 2008. However, by aligning on the same day, we get a better sense of the present-day synchronous behavior of the markets than if we align the lows.
(Click to enlarge)
A Longer Look Back
Here's a similar chart starting from the turn of 21st century — this time with the addition of the Bombay SENSEX, which has been a dramatic outperformer, although it's off its recent highs.

(Click to enlarge)