According to Altos Research, housing prices continued to decline in October 2010.![]() The headlines from their report:
The headlines from their report:
October 2010 showed us continued decreases in price, seasonal declines in inventory and revealed growing weakness in the markets most impacted by the bubble burst three years ago. As expected for the seasonal pattern, tracking with our 90-day rolling average, home prices fell, though weekly data as of November 7 show some stability at the national composite, so December’s price declines look to be slowing. Though inventory is down nationwide, the question of so-called "shadow inventory" and its impact looms large.
..........In what is becoming a familiar pattern, the Altos 10-City Composite fell in October 2010. The index was off 1.52% in September and another 1.60% during October to $458,518. These decreases are in line with our Q4 expectations, though weekly declines in prices are slowing. December’s report should indicate less dramatic price declines, with a few bubbly exceptions.
................As was the case in September, inventory across the country is decreasing, in some cases, significantly. Washington, DC had the biggest decrease at more than 16%, and inventory rose slightly in Las Vegas, Phoenix, and San Diego. Typically, decreases in inventory are evidence of a leveling off; that markets are settling. However, the spectre of shadow inventory remains, bringing with it questions about how foreclosures and short sales are being counted. The Altos 10-City index fell 4.64% in September.
Altos Research offers a real time indicator for home prices. The latest Case-Shiller data is for July 2010, while the October National Association of Realtor's (NAR) data is due out later this month.
images
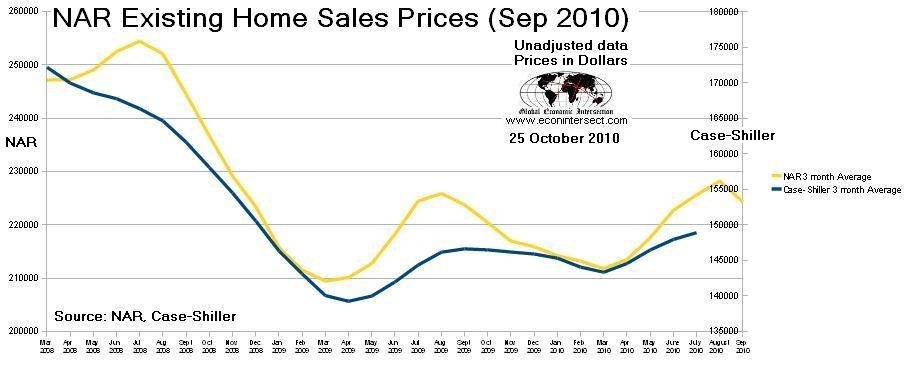
The Altos Research report has correlated well with Case-Shiller, uses only resales of single family dwellings in their data - and covers the 10 cities of Boston, Chicago, New York, Los Angeles, San Diego, San Francisco, Miami, Las Vegas, Washington, DC and Denver.
Another source, Clear Capital, has shown a 5.9% decline in home prices nationally over the two months preceding their latest report on October 22. The following graph shows their data:
![]()
In a press release today (November 9), Clear Capital offers an example that emphasizes that real estate is composed of local markets. The strongest market, according to their data, is Washington, DC. They provide the following graph to show a comparison of Washington to the national average.
![]()
All the latest data indicates we should expect to see a decline in the NAR data to be released this month, and start seeing a decline in the Case-Shiller data beginning in releases later this year. The housing market has a growing unpredictability as the mortgage crisis plays out. Econintersect believes home prices will continue to decline well into next year as uncertainty over foreclosures tends to weaken prices of high value assets.
Related Articles
- New Home Sales Downward Trend Continues by Steven Hansen
- NAR Existing Home Prices Begin Anticipated Decline by Steven Hansen
- Another View of Housing Price Trends by Ted Kavadas
- Demand for Housing Near an All-Time Low by John Lounsbury
Disclosure: Total portfolio is in cash.