Alibaba Group (Pending:NYSE:BABA) is consistently touted as being the largest e-commerce company in the world for good reason. When considering gross merchandise volume, or GMV, this statement is entirely true.
However, JD.com Inc. (JD) has appeared on the scene as an anomaly. The company generates about a tenth of Alibaba's GMV yet is on pace to produce roughly 64% more net revenue by 2015.
For investors considering an investment in either company, the tradeoff seems quite simple, net revenue growth for profits with Alibaba being a profit generating monster. However, net income may not be the best way to measure profits, as certain line items are murky and free cash flow gets at each company's operating "profitability" more clearly.
Alibaba recently provided Amendment No. 5 to Form F-1 to the Securities and Exchange Commission, or SEC. This amendment included Alibaba's updated information for the June 30, 2014 second quarter.
This information is highly valuable for further assessments of Alibaba and for comparison to JD. Ultimately, both of these companies will continue to dominate China's e-commerce market.
All the information displayed below has been built into proprietary databases and has been sourced from the SEC's website.
NET REVENUE
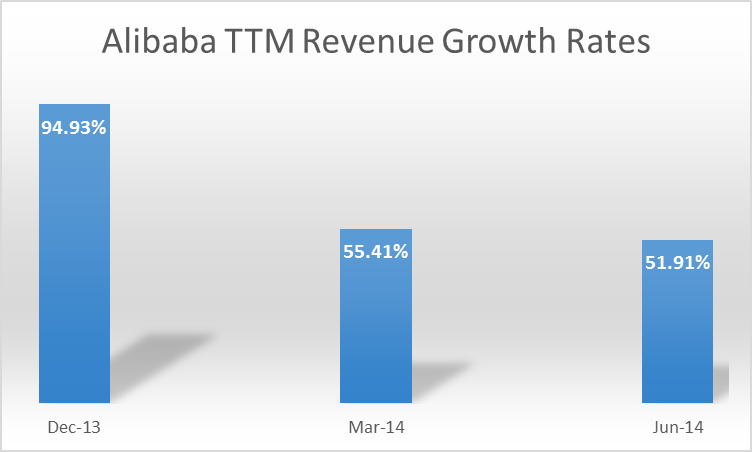
Alibaba's net revenue improved on a year-over-year, or y/y growth rate basis; however, the trailing twelve-month, or TTM trend continued its decline. The June 2014 quarterly improvement has moderated the rate of decline as seen below.
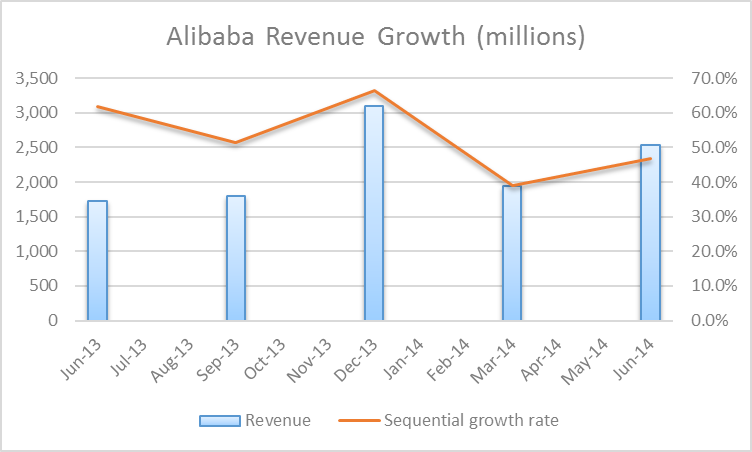
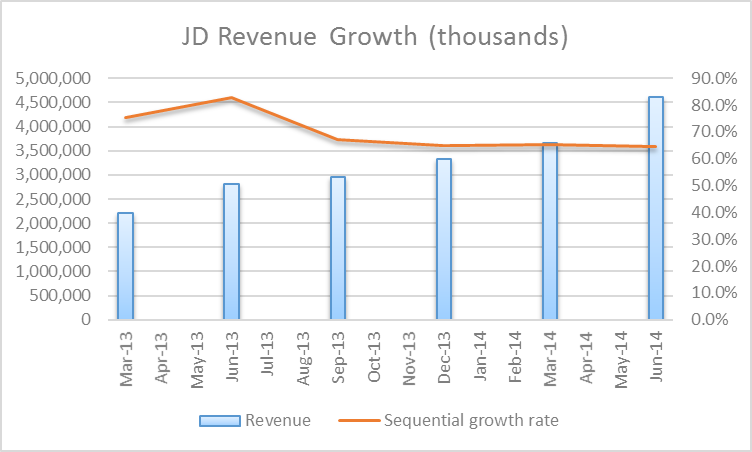
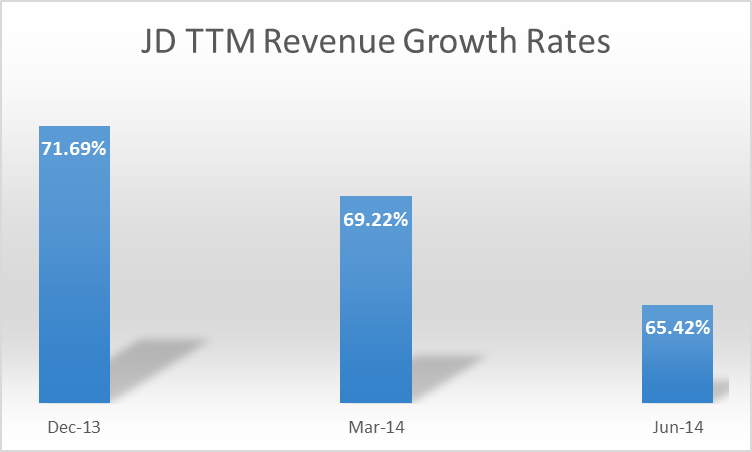
At this point it is valuable to consider Alibaba's closest competitor, JD, as both companies report during similar quarterly periods despite being on different fiscal years. When comparing growth rates JD clearly is achieving more consistent quarterly sequential growth.
However, solely focusing on net revenue growth rate trends does not really provide us with distinctions between how each of these companies focus on net revenue generation. Fundamentally, JD provides direct online sales to customers via an extensive network of warehouses, distribution centers, pick-up locations, and delivery services.
This is quite different compared to Alibaba's third-party and marketplace approach. Additionally, Alibaba provides payment services, micro-finance services through SME loan businesses, and cloud computing and Internet infrastructure services. JD also is attempting to grow its marketplaces and advertising business to compete with Alibaba; the company provides other added-value fulfillment services.
The tables below will consider both Alibaba and JD's most recent net revenue segment information. Each updated filing has provided added information so the assessment will focus on June 2014 y/y information being the most recent for both companies.
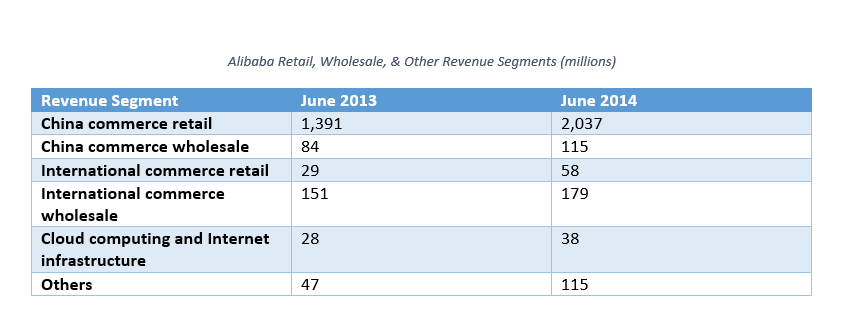
The telling information from the table above is that China commerce retail is the most significant part of Alibaba's business. In fact, Chinese retail and wholesale revenue accounts for 90% of the total combined when including international.
It should be noted that Alibaba has initially disclosed this information on a quarterly perspective just now in a prospectus document. Whether they continue in the future will remain to be seen. Quarterly information is usually filed with the SEC as a 6-K document for foreign companies. These documents are not required to report explicit or comprehensive information as 10-Q filings are.
The smaller business segments, including international commerce retail and others, display the most robust y/y revenue growth rates at 100% and 145%, respectively. We can assume that 11 Main in the U.S. is part of this international growth; again hopefully these same line items will be available on a continuing quarterly basis. When considering cloud computing and Internet infrastructure and others revenue segments, it is fairly certain that these businesses are predominantly, if not all, within China.
On a total net revenue basis, this places 91% of Alibaba's revenue as being generated from China. With international commerce wholesale revenue growing near 20% YOY, it would appear that the retail side offers the most upside at the moment; this is why reporting this type of information quarterly is so valuable. I suspect that China will continue to dominate the proportion of net revenues in the near-term.
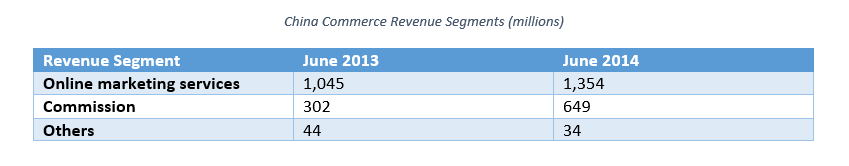
The other new information that was provided by Alibaba includes a breakdown of China commerce net revenue by online marketing services, commission, and others. We do not get the added breakout of retail versus wholesale here, but we know how dominant retail is in China from the previous table. What is interesting is that the commission line segment is by far the fastest growing segment here at 115% y/y. Online marketing services grew 30% y/y.
This explains why Alibaba has been aggressively pursuing stakes in companies like Weibo Corporation (WB) and Youku Tudou (YOKU). The company is looking to accelerate growth as it appears this segment is slowing due to competitive factors; again, continued quarterly information will validate this more. On the other hand, commission net revenues, which are based upon a percentage of GMV transacted on Tmall, Juhuasuan, and AliExpress, are increasing in line with the company's China-based retail net revenue growth.
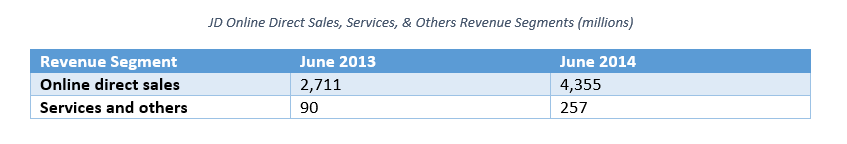
JD generates 100% of its net revenues within China. The company will continue to focus intently within this geography. Unfortunately, JD did not disclose the company's net revenues for online direct sales by electronics and home appliances versus general merchandise products on its quarterly 6-K. This information is included annually.
Online direct sales revenue grew 61% y/y while services and others revenue grew 186% y/y. JD attributed the more robust growth in services and others to the rapidly expanding online marketplace and advertising services. As JD launched level-one access on Tencent Holding's (OTCPK:TCEHY) Weixin platform for selected Weixin users in Beijing and Shanghai in late May (subsequently it was rolled out to all users at the end of June), this segment should see more robust traction in the back-half of the year. Regardless, the services and others segment is approaching over $1 billion in revenue for the year which should translate to the 200% y/y level above the near $400 million generated in 2013.
The company also launched its mobile virtual network operator, or MVNO business in mid-May allowing JD subscribers to gain benefits, including discount shopping and financial services, among others.
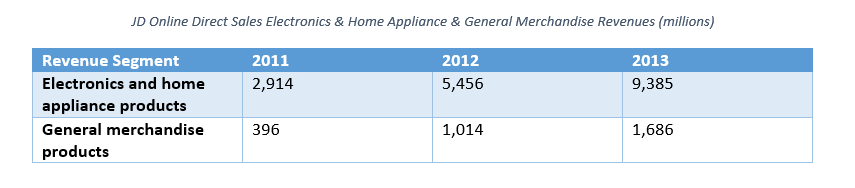
The above table is meant to give investors a sense of how electronics and home appliances reflect a majority of JD's online direct sales revenues; 85% in 2013. The rate of decline when comparing 2011 to 2013 net revenue growth has been much higher for the general merchandise segment.
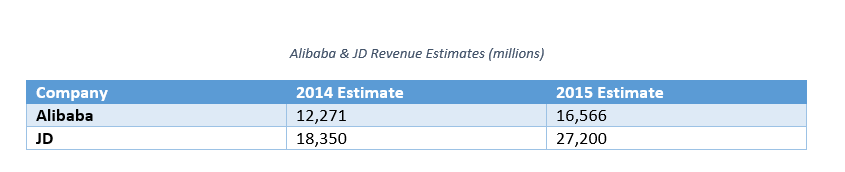
(Note that Alibaba's estimates are for fiscal years 2015 and 2016 in the above table whereas JD's are 2014 and 2015).
Analyst estimates for JD reflect continued moderate net revenue growth rate declines to 60% and roughly 50% for 2014 and 2015. Alibaba is not yet public and the company does not have analyst estimates. The above numbers reflect assumed growth rates of 45% and 35%, respectively, from 2013 numbers.
Ultimately, over the remainder of the year we should see some impacts from JD's relationship with Tencent and recent launches for marketplaces and advertising services. I expect Alibaba to continue to look to partner on the marketing services front with Chinese advertising companies. Unfortunately, the competitive environment from Baidu, Inc. (BIDU) and others will continue to challenge each investment Alibaba makes.
KEY METRICS
There are a few other ways to get at the scale of each of these two companies by considering their core operating metrics. These measures are also primary drivers for each company's respective net revenue growth and include GMV, active buyers or customers, orders fulfilled, and mobile penetration.
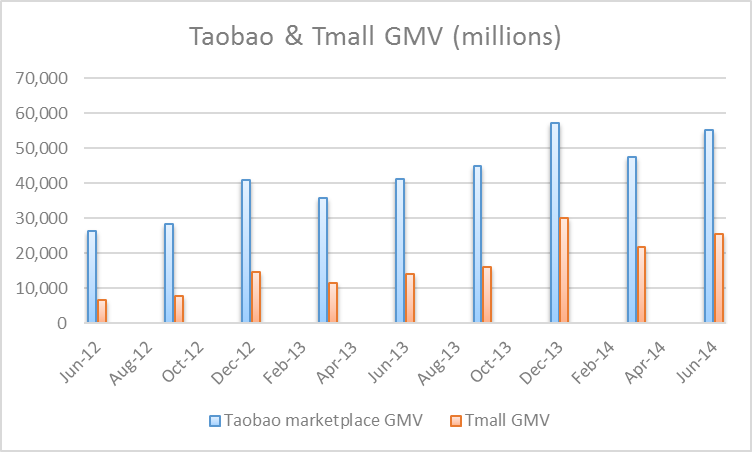
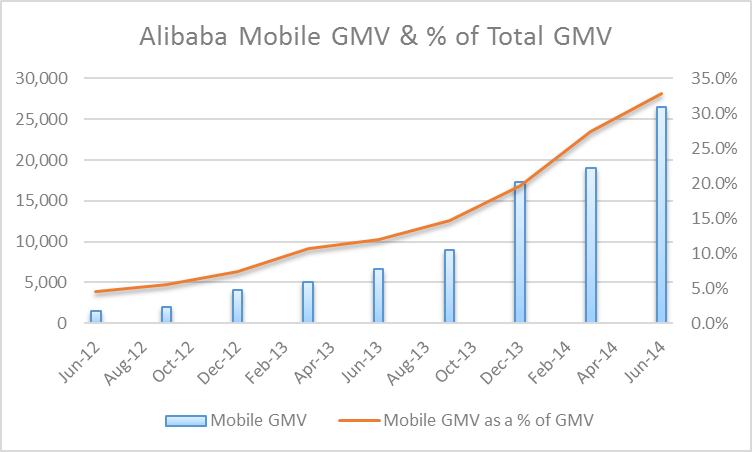
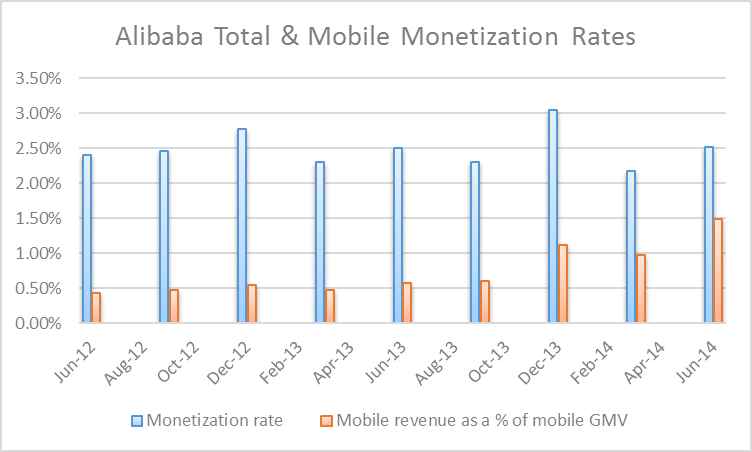
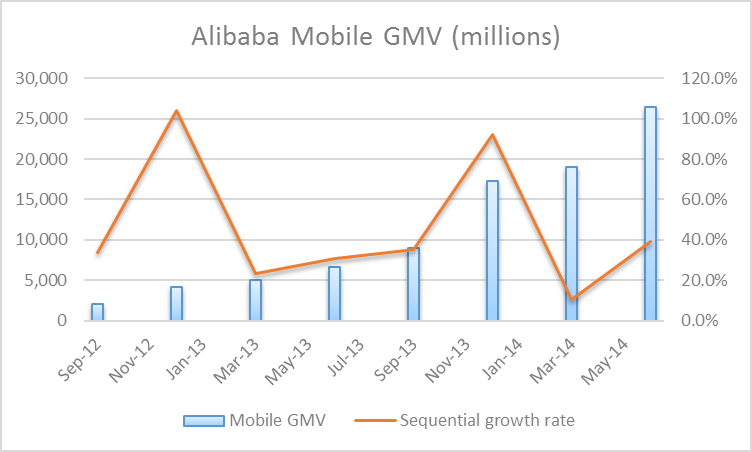
As seen by the charts above, Alibaba provides excellent coverage of the primary way for investors to understand how to estimate and calculate the company's net revenues. As an example, by combining the Taobao and Tmall GMV for the June 2014 quarter, we get roughly 80.7 billion in GMV. From the monetization rate of 2.52%, a simple calculation yields just over $2 billion which equates to the China commerce retail segment. The same can be performed to get the roughly $395 million for mobile net revenue during the quarter.
Nearly one-third of all GMV now occurs from mobile. From the monetization rate, it should also be understood that this includes both online marketing services and commission. Referring back to previous charts, we know that Alibaba is seeing robust commission growth, while marketing is potentially slowing.
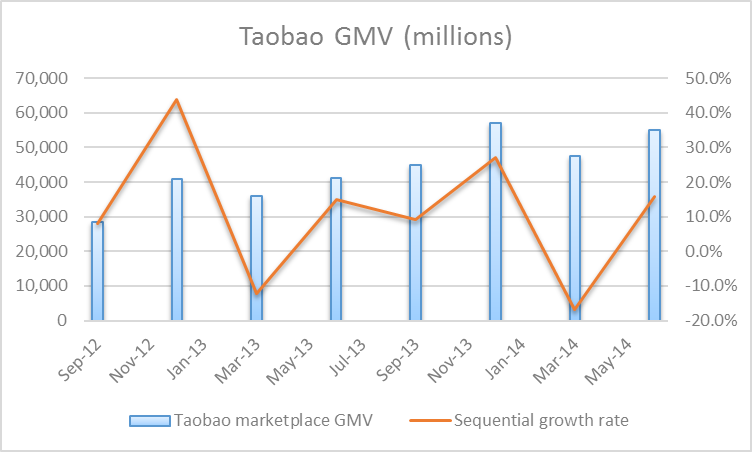
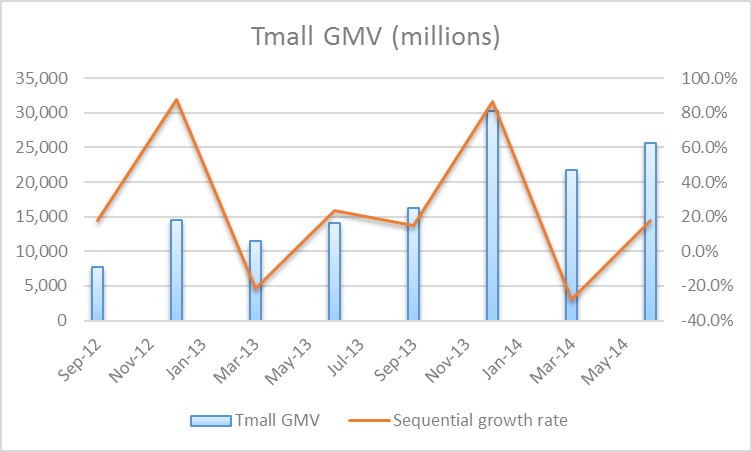
These above three charts may seem redundant, but they illustrate an important relationship for Alibaba's seasonality. Both Taobao and Tmall GMV display steep declines during the slower period which is the calendar year first quarter. Taobao, Alibaba's more significant GMV generator also showed less growth during last year; the recovery during June may or may not be a sign of further accelerated growth for the remainder of the year.
For mobile GMV, while the growth rates are more robust, we should expect to see similar trends over the next few years where there will be negative growth seasonally during the first quarter of each calendar year. The company's revenues are already represented by one-third being mobile.
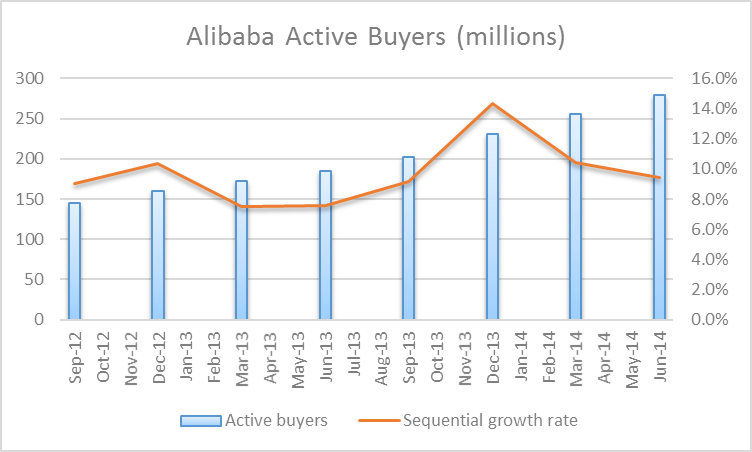
Active buyers reflect the primary driver for GMV. This calendar year will provide further information as to whether Alibaba's primary marketplaces continue to experience decelerating growth or whether this year will provide more momentum to the upside. China still remains strongly impoverished so we should expect that they will not necessarily replicate western country Internet penetration and/or consumption rates in the near-term. Alibaba uses these lower rates as opportunistic further net revenue growth implications. We should see a potential ceiling for active buyers in the next three to five years leading to more moderate marginal growth over the long-term.
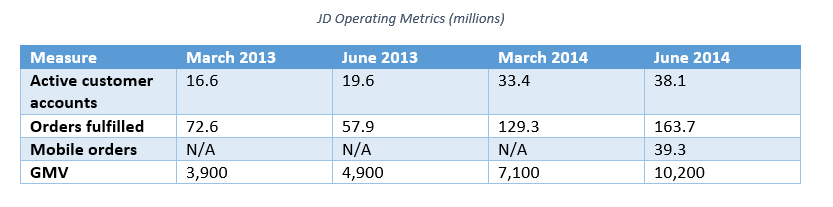
Unfortunately, JD does not provide the same level of comprehensive quarterly information to replicate charts for comparison. On a y/y basis for the June quarter, active customer accounts grew 94%; orders fulfilled grew 183%; and GMV grew 108%. On a June 2014 quarter comparative basis, JD's GMV at $10.2 billion was roughly 13% of Alibaba's total GMV at $80.7 billion. GMV growth for JD comparatively is growing 134% faster than Alibaba as Alibaba's growth rate for total GMV y/y for June was 46%. Mobile orders fulfilled at JD reflect 24% of the total orders fulfilled. This is the first quarter that this measure was included.
JD's total active customer accounts reflect roughly 14% of Alibaba's active buyers. It is highly likely that users in China would have an account with both Alibaba and JD. As JD continues to gain momentum, there is still significant upside potential; however, the extent that JD's direct online sales model will scale proportionally to Alibaba is uncertain.
Overall, JD has proven that it can generate more net revenue than Alibaba without depending on the same level of GMV. Additionally, JD has displayed that it has potential to be competitive with Alibaba from a marketplaces and online advertising perspective. Alibaba is intent on investing within the Chinese logistics infrastructure space. The company has significantly increased its leverage to $11 billion. Generating $16 to $20 billion in IPO proceeds will be crucial to Alibaba's 5-year budget plans for competing in the e-commerce market within Asia alone.
PROFITABILITY
Alibaba's profit margin has routinely been above 40% during the past six quarters in a row. There is no comparison when we measure this against JD. JD has not yet achieved profitable net income. However, both companies are best suited for investors to consider their free cash flow rather than net income. This is due to the fact that as both companies are early within their public trading, there are multiple line items which will adjust over time and/or there are line items which justify the use of the cash flow statement.
For example, JD recognized a preferred shares redemption value accretion on its June quarter net income statement. This amount necessitated an over $1 billion expense attributable to shareholders. Alibaba during the same quarter recognized over $1 billion in interest and investment income, net; including a net gain from step-up acquisition arising from revaluations of previously held equity interest. These amounts are reestablished on the operating cash flow line items to better reflect cash generated from operations versus net income.
Unfortunately, foreign companies, especially Chinese companies, generally only provide cash generated from operations and free cash flow without the line items on a quarterly basis in 6-K filings. There is not enough information quarterly to provide comparative examples, so the tables below reflect annual information.
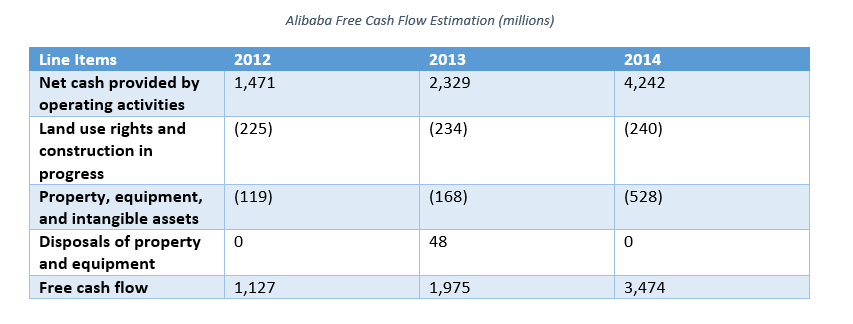
Alibaba actually provides how it determines free cash flow. This is through net cash provided by operating activities, purchase of property, equipment, and intangible assets (excluding land use rights and construction in progress), and changes in loan receivables, net. I have used a more conservative assessment above which will be comparable with JD. Annually, the loan receivables are already included in the net operating cash flow.
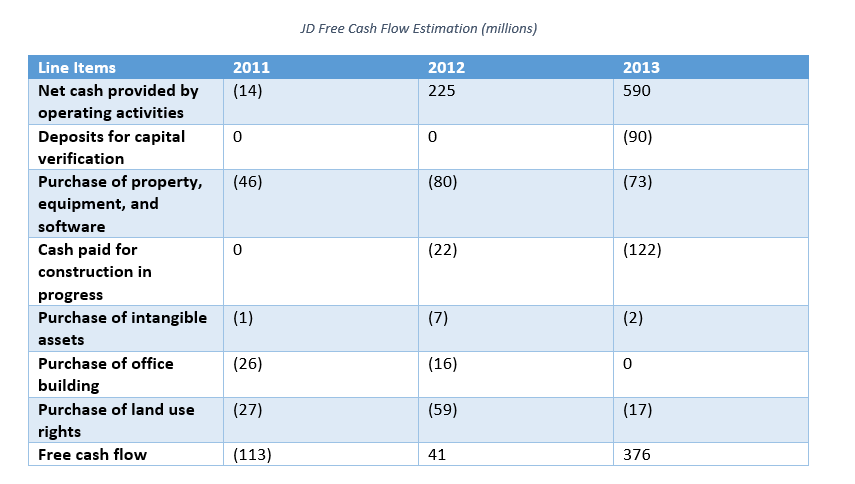
When comparing both companies Alibaba clearly outperforms JD significantly from a free cash flow perspective. JD is growing more robustly, but again as in other instances such as GMV, from a smaller level than compared to Alibaba. For each company's most recent fiscal year, free cash flow margin was 41% for Alibaba and 3% for JD. Since JD is publicly traded, from last week's close this puts JD's TTM price to free cash flow near 145 times on a diluted share basis. Comparatively at a price today of $60/share for Alibaba, it would similarly trade near 40 times free cash flow on a TTM diluted basis (assuming 2.3 billion shares).
From JD's prospectus disclosure we know that the company has a three-year plan to spend roughly $1.2 billion on fulfillment infrastructure. This pales in comparison to what Alibaba has suggested it will invest over the next 5 years; however, we have already seen that Alibaba is not shy of investing in anything and everything. The company expensed $2.7 billion for acquisitions of equity investees in 2014 and is not showing signs of slowing down during fiscal year 2015. Alibaba's statements as to its budget goals for the future are better left to the actions of the present and the past.
CONCLUSION
Clear takeaways are that JD will consistently generate higher net revenue than Alibaba based on its online direct sales model. Over the past two years, despite significant scale, Alibaba has not substantially increased its monetization rate, suggesting that its business model is not currently able to generate higher net revenues without strong volume growth. JD may be in a similar situation, yet it monetizes more net revenue per GMV.
More importantly for the majority of investors is the fact that Alibaba has a current 41% free cash flow margin compared to JD's 3% margin. Some revenue scale between the two can be attributed to this, but if we consider it another way, JD's free cash flow is roughly 11% of Alibaba's free cash flow. It makes sense when we reconsider that JD's GMV and active customer accounts are near similar levels as mentioned above. Ultimately, this fact is what brings most attention to Alibaba.
Investors should consider the fact that JD has improved its gross margins over the past few quarters and that its investments in fulfillment will provide substantial increases in free cash flow. Combined, the company is poised to grow its free cash flow near $1.00/share. Alibaba will most likely trade near 40 to 50 times diluted free cash flow per share on its IPO day. As long as both companies continue to grow robustly, both will offer investors strong investment returns over the long-term.
For the remainder of this calendar year through next year, investors should pay close attention to the growth in Alibaba's international commerce retail and other revenue segments. This is where 11 Main and the micro-finance businesses are contained. Within the China commerce segment, closely watching the online marketing services and commission line items will be key. Generally, we will get a sense of this from the China commerce retail segment. If GMV and active buyers begin to slow more quickly, Alibaba will need to rethink their investments into Chinese advertisement businesses.
For JD, investors should strictly watch the services and other segment as this segment houses the most competitive pieces against Alibaba. Additionally, watching the general merchandise product segment will be important as JD needs to keep momentum on this front to be successful over the long-term. Expectations are going to be high from JD's partnership with Tencent. Mobile is one of the areas where JD has the potential outperform Alibaba in the near-term and successful coordination with Tencent is key.
One other important aspect is the competitive environment. Other key companies, including Vipshop Holdings (VIPS), E-Commerce China Dangdang (DANG), and Jumei International Holding (JMEI), among others, will be factors over the near and long-term. All three companies generated TTM e-commerce net revenue within China as follows, $2.6 billion, $1.2 billion and $573 million, respectively. As these companies scale, they will have impacts on general merchandise and marketplace net revenues with online advertising being potential as well.
The Asian e-commerce market will arguably be more interesting and successful than western markets over the next decade.