I love wide moat businesses, and there is no better example of a wide moat than a railway. Despite rail transport being the cheapest for goods compared to by truck or by air, the massive track networks and requisite capital expenditures keep new companies out of the railway space. In the case of Canada, only two major railways operate, Canadian National (NYSE:CNI) and Canadian Pacific (CP).
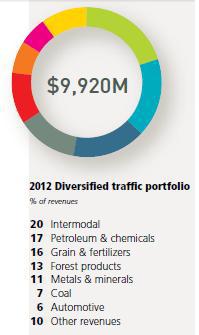
Unique among the North American Railroads, Canadian National Railway possesses the lowest operating ratio of 63.4%, while having access to three coasts; the Pacific, Atlantic, and Gulf of Mexico. The greater network of Canadian National over Canadian Pacific gives CNI a distinct advantage. On this network over 300 million tons of cargo worth 250 billion dollars moves; this represents 20% of Canada's exports.
, source: annual report)
With some of the best transit times in the industry, growth has recently been spurred by the US housing recovery, delay of pipeline projects and the growth of oil by rail transport, and record grain harvests in Canada. Canadian National serves all major Canadian markets, as well as 75% of the US population. Canada is the world's largest potash supplier, and all major potash mines in Canada are served by CNI. Their strong market position has resulted in 17 consecutive dividend increases since their privatization in 1995.
, source:annual report)

A unique driving force for growth in CNI may be climate change. We have already seen the corn belt shift north into Canada as a result of changing climate and with increasing temperatures, a greater percentage of Canada's land has the potential of becoming arable or increasing yields for various crops. With Canadian National's strong North American rail network, they would be in an excellent position to profit from increased Canadian agriculture.
Canadian National maintains a strong history of year of year revenue growth. From 2009 to 2013 revenue growth has ranged from almost 13% from financial 2009 to financial 2010, and this has declined to 6.6% growth from financial 2012 to 2013. During this same period, gross profit margins have increased from 74.9% to 84.7%. Selling, general, and administrative expenses have held relatively constant the past five years. In 2009 42.1% of gross earnings were spent, and this has increased only slightly to 45.8% in financial 2013.
Canadian National's interest expense as a percentage of operating income has also decreased in recent history. In 2009 17.1% of operating income was spent, and this has been reduced by almost 50% by the end of financial 2013. Simultaneously, depreciation expenses as a percent of gross income has shown a significant decrease from 14.3% in 2009 to 10.9% in 2013.
Net income has shown a general increasing trend, however there was a slight decrease (2%) from 2012-2013. The previous four years showed year over year net income growth ranging from 9 to 17%. EPS share growth did increase in financial 2013 by 0.7%, however far lower than the previous four years of double-digit growth; from 2009 to 2012 EPS grew at 14, 21 and 13% respectively. During this time, return on assets grew from 7.4% in 2009 to 8.7% in 2013.
Over the past five years, both long term and short term debt have increased, and the ratio of short term to long term has increased from 0.014 to 0.15. This indicates the company is becoming slightly more liberal with debt in this period of record low interest rates. Despite this, the number of years to pay off all long term debt using net earnings has decreased from 3.45 years in 2009 to 2.6 years most recently. The debt to shareholder equity ratio (adjusted for treasury stock) has shown a slight increase over the past five years from 0.11 in 2009 to 0.28 in 2013, however it still remains appropriately low.
Indicative of their strong financial position, each of the past five years has shown an increase in retained earnings. However, the year-over-year percentage increase of retained earnings has decreased from 10% in 2009-2010 to 6% in 2012-2013. Despite this, the return on equity (adjusted for treasury stock) has increased from 16.5% in 2009 to 29.2% currently.
CNI is in extremely good financial shape for the future, and the moat of the business indicates that it is very close to being a 'forever' stock. However, at the same time, the P/E has grown to over 23, a level unprecedented in years, and up significantly from the 15 and lower seen in mid 2012. (Graph source:ycharts.com)

As a result of this, we do not recommend purchasing CNI at present levels. We will be looking to add to our position when the p/e falls more in line with historical values, preferably under 15.