There was a time when Monster (MWW) was a high-flying stock, with a very, very optimistic future as an employment services company. But more recently, LinkedIn (LNKD) has taken the professional networking space by storm, but let's face it, most professionals prefer to keep their business private. We just don't think that there's a lot of comfort in the interface. How many employees, for example, feel comfortable posting in an area where there boss will see? Maybe employers are thirsty to fill jobs during these extremely optimistic times of the economic cycle, but what about the downturn? We don't think LinkedIn investors are even thinking about a recession at the moment. Let's calculate the true intrinsic value for shares.
LinkedIn's Investment Considerations

Investment Highlights
• LinkedIn earns a ValueCreation™ rating of EXCELLENT, the highest possible mark on our scale. The firm has been generating economic value for shareholders for the past few years, a track record we view very positively. Return on invested capital (excluding goodwill) has averaged 80% during the past three years.
• LinkedIn operates the world's largest professional network on the Internet in over 200 countries and territories. On its website, members create, manage and share their professional identity and build out their professional networks in order to facilitate a more productive and successful career.
• Because of the enormous membership growth LinkedIn has demonstrated during the past several years, corporate human resources departments continue to shift their budgets toward LinkedIn over traditional talent recruitment sources. Sales of LinkedIn's Talent Solutions products have surged as a result.
• LinkedIn's business model is relatively unproven, and historical growth has masked all cyclicality, which may be severe. Competition from a variety of fronts could overwhelm the firm's network effect, inevitably disrupting its business model. The magnitude of future growth and profitability are other key uncertainties.
• Though we think LinkedIn is a wonderful company with a great business model and tremendous long-term earnings potential, the price is still too far ahead of the underlying fundamentals.
• We like to ask the question sometimes: is this a company Warren Buffett would invest in? The answer is clearly no, in our view.
Business Quality

Economic Profit Analysis
The best measure of a firm's ability to create value for shareholders is expressed by comparing its return on invested capital with its weighted average cost of capital. The gap or difference between ROIC and WACC is called the firm's economic profit spread. LinkedIn's 3-year historical return on invested capital (without goodwill) is 80%, which is above the estimate of its cost of capital of 11.8%. As such, we assign the firm a ValueCreation™ rating of EXCELLENT. In the chart below, we show the probable path of ROIC in the years ahead based on the estimated volatility of key drivers behind the measure. The solid grey line reflects the most likely outcome, in our opinion, and represents the scenario that results in our fair value estimate.


Cash Flow Analysis

Firms that generate a free cash flow margin (free cash flow divided by total revenue) above 5% are usually considered cash cows. LinkedIn's free cash flow margin has averaged about 15% during the past 3 years. As such, we think the firm's cash flow generation is relatively STRONG. The free cash flow measure shown above is derived by taking cash flow from operations less capital expenditures and differs from enterprise free cash flow (FCFF), which we use in deriving our fair value estimate for the company. For more information on the differences between these two measures, please visit our website at Valuentum.com. At LinkedIn, cash flow from operations increased about 59% from levels registered two years ago, while capital expenditures expanded about 122% over the same time period.
Valuation Analysis
Our discounted cash flow model indicates that LinkedIn's shares are worth between $102-$212 each. This is the wide range of fair value estimate outcomes that we were talking about. The margin of safety around our fair value estimate is driven by the firm's HIGH ValueRisk™ rating, which is derived from the historical volatility of key valuation drivers. We think this is fair.
The estimated fair value of $157 per share still represents an astronomical multiple on the basis of forward earnings. Our valuation model reflects a compound annual revenue growth rate of 30.8% during the next five years, a pace that is higher than the firm's 3-year historical compound annual growth rate of 16.3%. Our valuation model reflects a 5-year projected average operating margin of 15.1%, which is above LinkedIn's trailing 3-year average. Obviously, if we enter a recession, these growth numbers would be reduced, which is why we like to publish a range instead of a point fair value estimate. The company is trading north of $200 at present!
Beyond year 5, we assume free cash flow will grow at an annual rate of 17.3% for the next 15 years and 3% in perpetuity. For LinkedIn, we use a 11.8% weighted average cost of capital to discount future free cash flows. We think the long-term growth rate and discount rate are appropriate for a firm with LinkedIn's risk profile.


We understand the critical importance of assessing firms on a relative value basis, versus both their industry and peers. Many institutional money managers -- those that drive stock prices -- pay attention to a company's price-to-earnings ratio and price-earnings-to-growth ratio in making buy/sell decisions. With this in mind, we have included a forward-looking relative value assessment in our process to further augment our rigorous discounted cash flow process. If a company is undervalued on both a price-to-earnings ratio and a price-earnings-to-growth ratio versus industry peers, we would consider the firm to be attractive from a relative value standpoint. For relative valuation purposes, we compare LinkedIn to peers Baidu (BIDU) and Facebook (FB).

Margin of Safety Analysis
Our discounted cash flow process values each firm on the basis of the present value of all future free cash flows. Although we estimate the firm's fair value at about $157 per share, every company has a range of probable fair values that's created by the uncertainty of key valuation drivers (like future revenue or earnings, for example). After all, if the future was known with certainty, we wouldn't see much volatility in the markets as stocks would trade precisely at their known fair values. Our ValueRisk™ rating sets the margin of safety or the fair value range we assign to each stock. In the graph below, we show this probable range of fair values for LinkedIn. We think the firm is attractive below $102 per share (the green line), but quite expensive above $212 per share (the red line). The prices that fall along the yellow line, which includes our fair value estimate, represent a reasonable valuation for the firm, in our opinion.

Future Path of Fair Value
We estimate LinkedIn's fair value at this point in time to be about $157 per share. As time passes, however, companies generate cash flow and pay out cash to shareholders in the form of dividends. The chart below compares the firm's current share price with the path of LinkedIn's expected equity value per share over the next three years, assuming our long-term projections prove accurate. The range between the resulting downside fair value and upside fair value in Year 3 represents our best estimate of the value of the firm's shares three years hence. This range of potential outcomes is also subject to change over time, should our views on the firm's future cash flow potential change. The expected fair value of $219 per share in Year 3 represents our existing fair value per share of $157 increased at an annual rate of the firm's cost of equity less its dividend yield. The upside and downside ranges are derived in the same way, but from the upper and lower bounds of our fair value estimate range.

Pro Forma Financial Statements


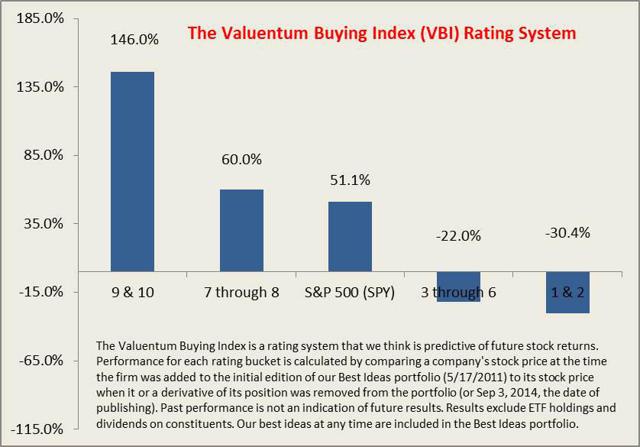
In the spirit of transparency, we show how the performance of the Valuentum Buying Index has stacked up per underlying score as it relates to firms in the Best Ideas portfolio. Past results are not a guarantee of future performance.