* All data are as of the close of Tuesday, October 14, 2014.
While the Utilities sector has been grossly underperforming the broader market S&P at half its growth rate since the start of the economic recovery after the 2008-09 financial crisis, the largest three U.S. Diversified Utility companies have put in a split performance, as noted in the graph below.
Where the broader market S&P 500 index [black] has grown some 178% and the SPDR Utilities sector ETF (NYSE: XLU) [blue] has gained half as much at just 90% since the recovery began in early March of 2009, two of our three Diversified Utilities - Sempra Energy (NYSE: SRE) [orange] and Duke Energy Corporation (NYSE: DUK) [beige] - have ranged below the broader market and above the utilities sector with gains of 175% and 120% respectively. Exelon Corporation (NYSE: EXC) [purple], on the other hand, has floundered throughout, shrinking some 20%.
On an annualized basis, where the S&P broader market has averaged 31.9% per year and the Utilities sector fund XLU has averaged 16.1% per year since March of '09, Sempra has averaged 31.3%, Duke has averaged 21.5%, while Exelon has averaged -3.6% per year.

Source: BigCharts.com
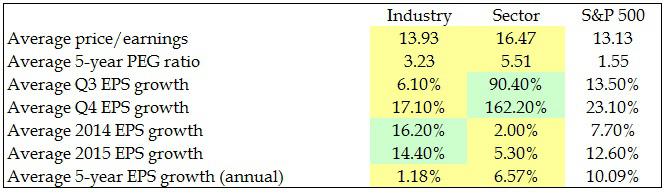
While the Utilities sector is seen vastly outperforming the S&P broader market in Q4 of this year, such a stellar performance is not expected to repeat in 2015 and beyond, as noted in the table below where green denotes outperformance and yellow marks underperformance.
The outlook is similar for the sector's Diversified Utilities industry. Although the industry should register slightly better earnings growth than the S&P in 2015, it is expected to grossly underperform beyond that.
The reason for such poor growth prospects is mostly likely the tightening of monetary policy by the U.S. Federal Reserve. With the last of its Quantitative Easing programs now complete, the next phase will be the gradual raising of interest rates beginning likely in late 2015 or early 2016.
As capital becomes more expensive to borrow, businesses that are capital intensive will incur higher financing costs which will cut into their profits. Considering the high debt levels of utility companies (our three candidates average debt loads of 67.7% of their market caps), we can understand why utilities are expected to register poor earnings going forward. They should have one good year left, however, before they start slipping dramatically.
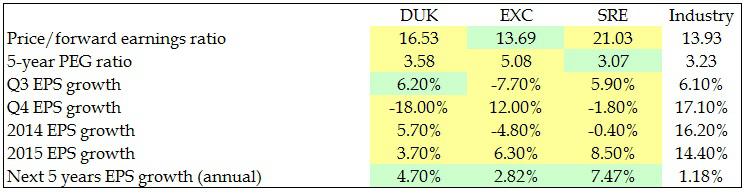
Within the Diversified Utilities industry, our three highlighted stocks of Duke, Exelon and Sempra are expected to remain fairly steady going forward, likely due to their large size which gives them an edge over smaller caps when times get tough. As tabled below, while all three giants are seen underperforming their industry in 2015, they should fair better than their peers over the next five years.
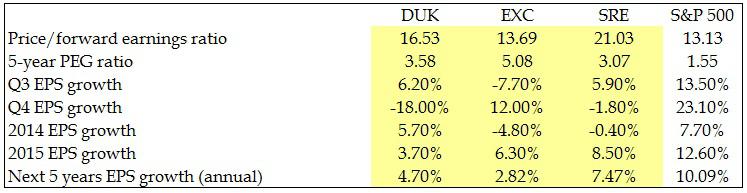
Compared to the broader market S&P 500 index, however, our three Diversified Utilities will underperform as noted below, again due to the expected higher financing costs over the next several years until "rate normalization", when interest rates return to their normal 5% to 6% range, likely by 2020 or so.
Even so, many investors prefer the stability of the large cap utilities. Though they may not shoot upward like the medium and small caps, neither do they tumble so deeply during periods of volatility, which are expected to increase in frequency as interest rates return to normal levels.
Hence, all three of our Diversified Utility giants will continue to hold a place in many portfolios as solid mature companies offering stability and steady dividend incomes which are among the best on the market. But how do they compare against one another, and which makes the best investment?
Let's answer that by comparing their company fundamentals using the following format: a) financial comparisons, b) estimates and analyst recommendations, and c) rankings with accompanying data table. As we compare each metric, the best performing company will be shaded green while the worst performing will be shaded yellow, which will later be tallied for the final ranking.
A) Financial Comparisons
• Market Capitalization: While company size does not necessarily imply an advantage and is thus not ranked, it is important as a denominator against which other financial data will be compared for ranking.

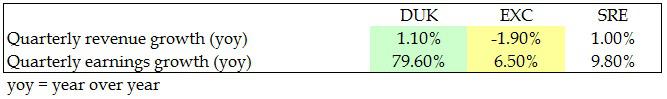
• Growth: Since revenues and expenses can vary greatly from one season to another, growth is measured on a year-over-year quarterly basis, where Q1 of this year is compared to Q1 of the previous year, for example.
In the most recent reported quarter, Duke's quarterly revenue and earnings growth were much more electrifying than the others', while Exelon's earnings were meager and its revenues shrank.
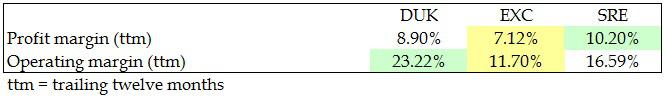
• Profitability: A company's margins are important in determining how much profit the company generates from its sales. Operating margin indicates the percentage earned after operating costs, such as labor, materials, and overhead. Profit margin indicates the profit left over after operating costs plus all other costs, including debt, interest, taxes and depreciation.
Of our three contestants, Sempra and Duke split first place on margins, while Exelon's margins were lowest.
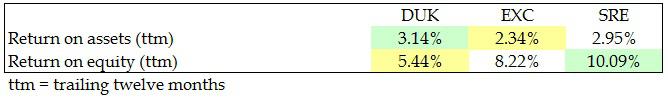
• Management Effectiveness: Shareholders are keenly interested in management's ability to do more with what has been given to it. Management's effectiveness is measured by the returns generated from the assets under its control, and from the equity invested into the company by shareholders.
In returns on assets and on equity, Duke's and Sempra's management teams again split the first prizes, with Duke and Exelon splitting the last place finishes.
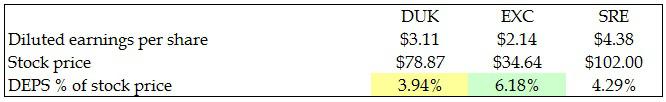
• Earnings Per Share: Of all the metrics measuring a company's income, earnings per share is probably the most meaningful to shareholders, as this represents the value that the company is adding to each share outstanding. Since the number of shares outstanding varies from company to company, I prefer to convert EPS into a percentage of the current stock price to better determine where an investment could gain the most value.
Of the three companies here compared, Exelon provides common stock holders with the greatest diluted earnings per share gain as a percentage of its current share price, while Duke offers the worst with Sempra not far ahead.
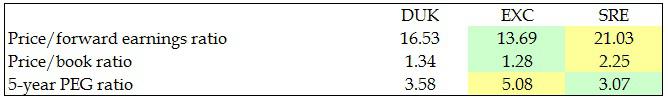
• Share Price Value: Even if a company outperforms its peers on all the above metrics, however, investors may still shy away from its stock if its price is already trading too high. This is where the stock price relative to forward earnings and company book value come under scrutiny, as well as the stock price relative to earnings relative to earnings growth, known as the PEG ratio. Lower ratios indicate the stock price is currently trading at a cheaper price than its peers, and might thus be a bargain.
Among our three combatants, Exelon has the cheapest stock price relative to forward earnings and company book value. While Sempra's stock price represents better value relative to 5-year PEG, it is the most overvalued of the three relative to forward earnings and company book.
B) Estimates and Analyst Recommendations
Of course, no matter how skilled we perceive ourselves to be at gauging a stock's prospects as an investment, we'd be wise to at least consider what professional analysts and the companies themselves are projecting - including estimated future earnings per share and the growth rate of those earnings, stock price targets, and buy/sell recommendations.
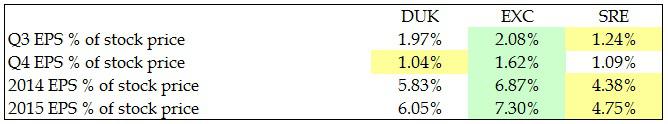
• Earnings Estimates: To properly compare estimated future earnings per share across multiple companies, we would need to convert them into a percentage of their stocks' current prices.
Of our three specimens, Exelon offers the best earnings percentages across all four time periods, while Sempra offers the worst EPS percentage over current stock price in three periods.
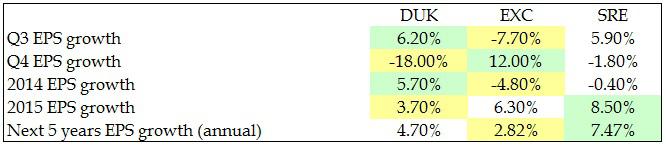
• Earnings Growth: For long-term investors this metric is one of the most important to consider, as it denotes the percentage by which earnings are expected to grow or shrink as compared to earnings from corresponding periods a year prior.
For earnings growth, Duke and Exelon are expected to post the superior growth this Q3 and Q4, while Sempra is expected to grow faster than the others in the future.
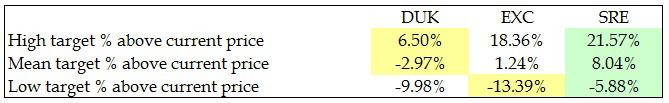
• Price Targets: Like earnings estimates above, a company's stock price targets must also be converted into a percentage of its current price to properly compare multiple companies.
For their high, mean and low price targets over the coming 12 months, analysts prefer Sempra's stock over the others. While Duke's stock is seen rising the least of the three, Exelon's is believed to have the greatest downside risk.
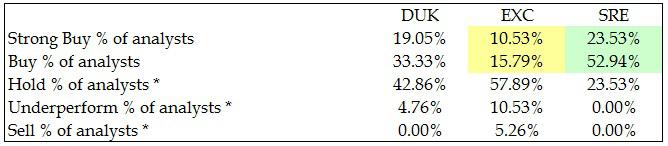
• Buy/Sell Recommendations: After all is said and done, perhaps the one gauge that sums it all up are analyst recommendations. These have been converted into the percentage of analysts recommending each level. However, I factor only the strong buy and buy recommendations into the ranking. Hold, underperform and sell recommendations are not ranked since they are determined after determining the winners of the strong buy and buy categories, and would only be negating those winners of their duly earned titles.
Of our three contenders, Sempra is best recommended with 4 strong buys and 9 buys representing 23.53% and 52.94% of its analysts, followed very close behind by Duke with 4 strong buys and 7 buys. Exelon is least recommended with 2 strong buy and 3 buy ratings.
C) Rankings
Having crunched all the numbers and compared all the projections, the time has come to tally up the wins and losses and rank our three competitors against one another.
In the table below you will find all of the data considered above plus a few others not reviewed. Here is where using a company's market cap as a denominator comes into play, as much of the data in the table has been converted into a percentage of market cap for a fair comparison.
The first and last placed companies are shaded. We then add together each company's finishes to determine its overall ranking, with first place finishes counting as merits while last place finishes count as demerits.
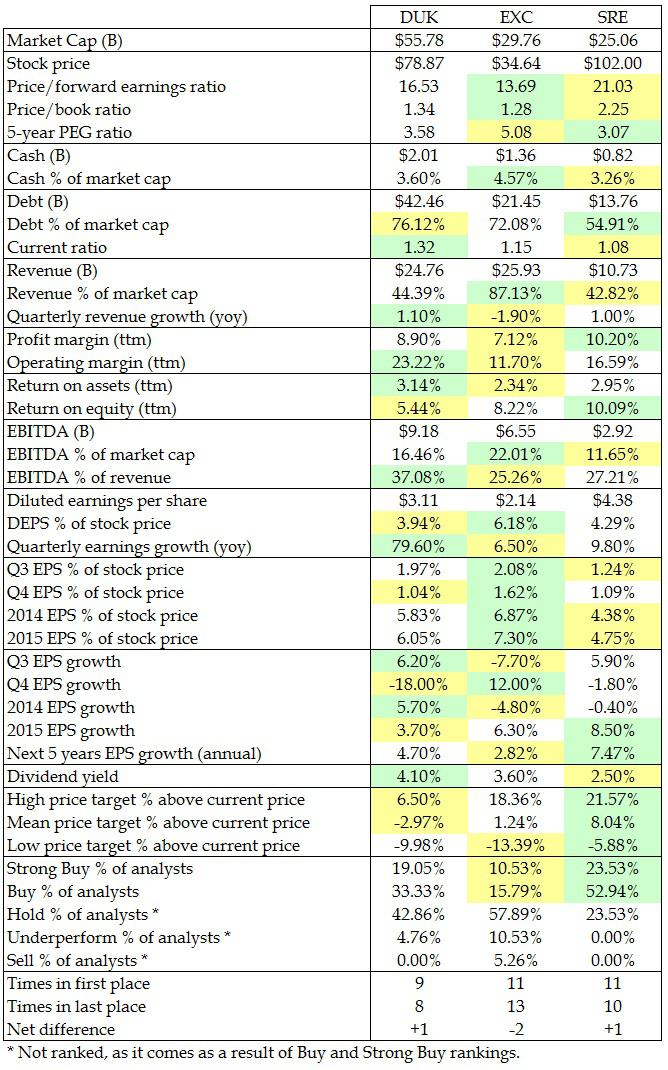
And the winner is… too close to call. It's a tie for first place between Duke and Sempra, while Exelon is not far behind at all. Since the number of first place rankings always breaks a tie, Sempra will be declared the winner in today's competition, outperforming in 11 metrics while underperforming in 10 for a net score of +1. Duke places second, outperforming in 9 metrics and underperforming in 8 for a net score of also +1. While Exelon crosses the finish line last but close, outperforming in 11 metrics and underperforming in 13 for a net score of -2.
While the Diversified Utilities industry is expected to outperform the S&P broader market modestly in 2015, it is seen underperforming dismally going forward as rising interest rates will increase their financing costs and cut into their profits.
Though the largest three U.S. Diversified Utilities of Duke Energy, Exelon Corporation and Sempra Energy do not offer very much growth and are expected to underperform the broader market S&P, all three should outperform their industry, making them strong additions to any portfolio looking for stability in volatile markets and attractive dividend income ranging from 2.50% to 4.10% annually.