Focus of Article:
The focus of this article is to provide a detailed projection of American Capital Agency Corp.'s (NASDAQ:AGNC) book value ("BV") per common share as of 9/30/2014. Prior to results being provided to the public on 10/27/2014 (via the company's quarterly press release), I would like to analyze AGNC's BV as of 9/30/2014 and provide readers a general direction on how I believe this recent quarter has panned out. A previous three-part article I wrote laid the groundwork for this BV projection. In that article, I projected/analyzed AGNC's income statement (technically speaking, the company's "consolidated statement of comprehensive income") for the third quarter of 2014. The links to that three-part projection article are provided below:
American Capital Agency Corp.'s Upcoming Q3 2014 Income Statement Projection - Part 1
American Capital Agency Corp.'s Upcoming Q3 2014 Income Statement Projection - Part 2
American Capital Agency Corp.'s Upcoming Q3 2014 Income Statement Projection - Part 3
This article will also include a brief BV discussion regarding AGNC's affiliate, American Capital Mortgage Investment Corp. (MTGE), and the company's closest sector peer, Annaly Capital Management, Inc. (NLY). This includes a BV projection as of 9/30/2014 for both companies.
Side Note: Predicting a company's accounting figures within the mortgage real estate investment trust (mREIT) sector is usually more difficult when compared to other sectors, due to the various hedging and asset portfolio strategies that are implemented by management each quarter. As such, there are several assumptions used when performing such an analysis. AGNC's actual reported values may differ materially from my projected values within this article, due to unforeseen circumstances. This could occur because management deviates from a company's prior business strategy and pursues a new strategy that was not previously disclosed or anticipated. Readers should be aware as such. All projections within this article are my personal estimates, and should not solely be used for any investor's buying or selling decisions. All actual reported figures that are above my ranges within this article will be deemed a positive sign, in my judgment. All actual reported figures that are below my ranges within this article will be deemed a negative sign, in my judgment.
Overview of AGNC's Projected BV as of 9/30/2014:
Due to the fact that several figures needed to project/calculate AGNC's BV as of 9/30/2014 come directly from the company's consolidated statements of comprehensive income, I provide Table 1 below. Table 1 shows AGNC's consolidated statements of comprehensive income from a three- and nine-months ended time frame. Using Table 1 below as a reference, one must add certain account figures from the first, second, and third quarters of 2014 for purposes of projecting a suitable BV as of 9/30/2014.
Table 1 - AGNC Three- and Nine-Months Ended Consolidated Statements of Comprehensive Income
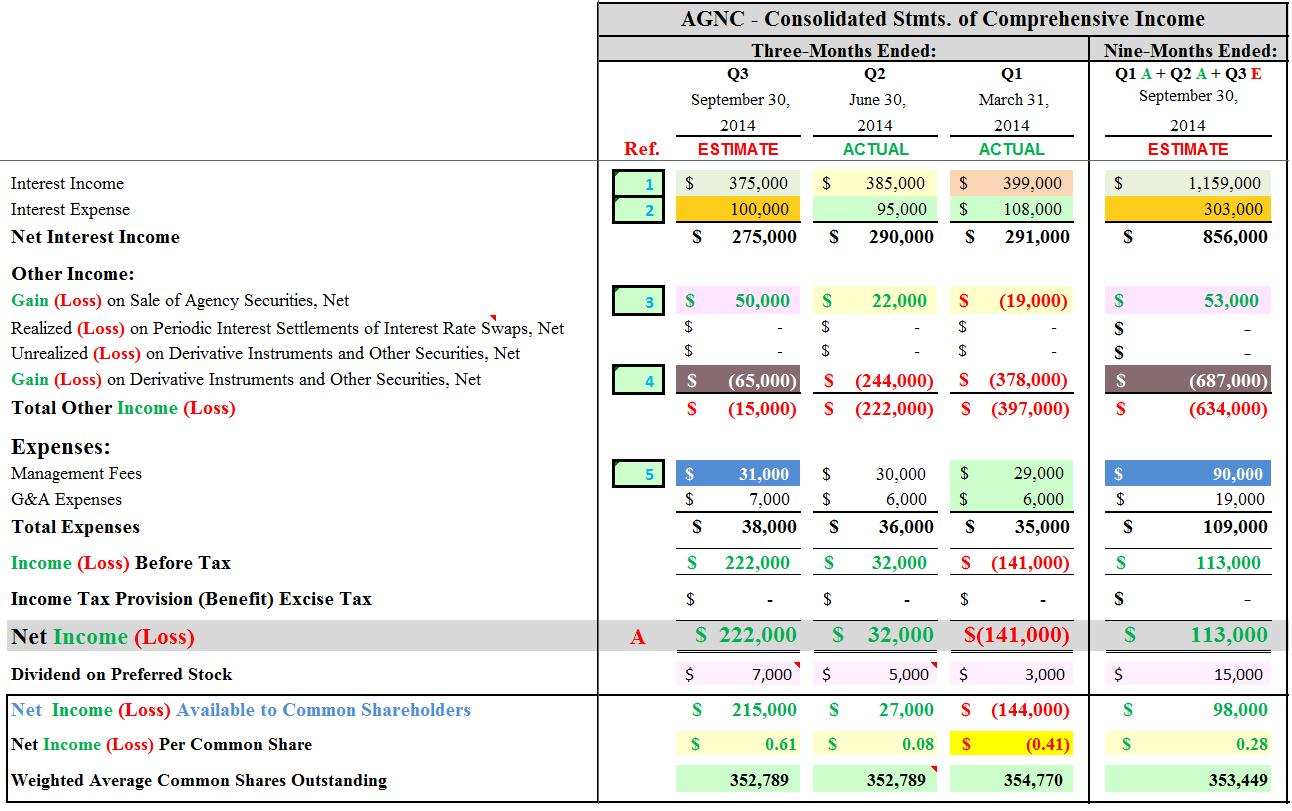
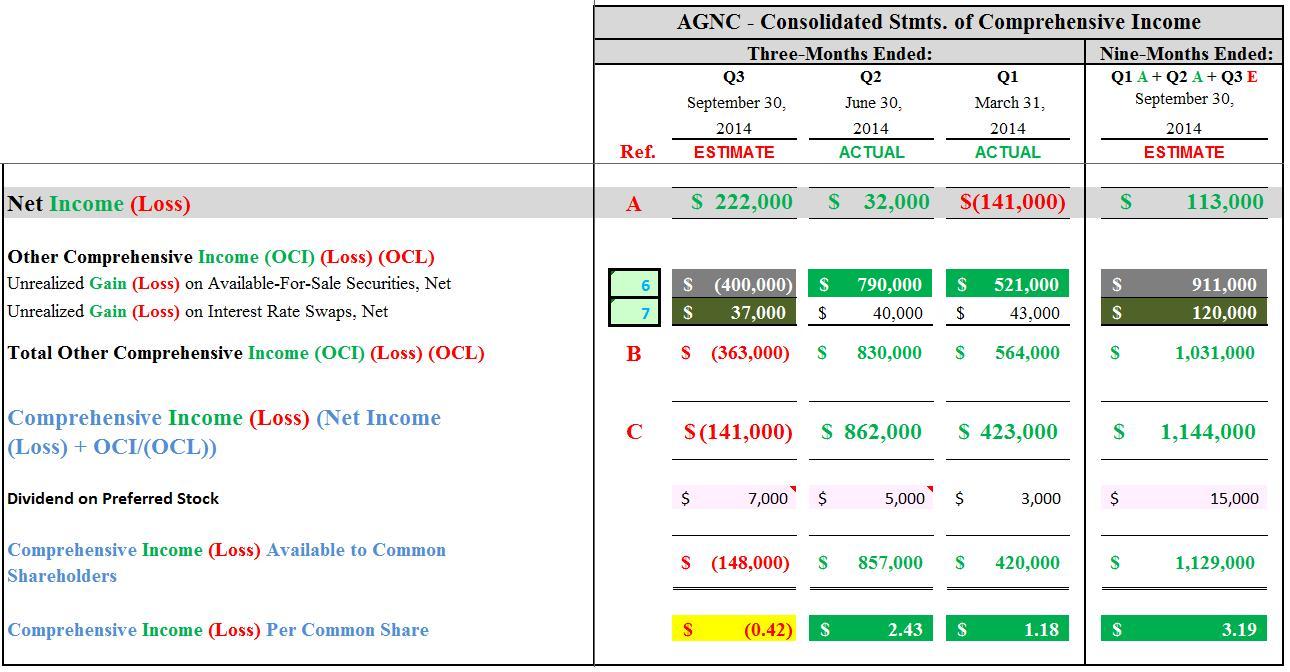
(Source: Table created entirely by myself, partially using data obtained from AGNC's quarterly investor presentation slides)
Having provided Table 1 above (in particular AGNC's "Nine-Months Ended (ESTIMATE)" column), we can now begin to calculate AGNC's projected BV as of 9/30/2014. This projection will be calculated in Table 2 below.
There will not be an identical sheet AGNC provides that matches the data I have prepared in Table 2. I have gathered specific information derived from multiple tables/charts for a more detailed analysis of AGNC's BV as of 9/30/2014. AGNC, through the company's quarterly investor presentation slides (see link above), only provides the public with a "Book Value Roll Forward" slide. This roll forward slide uses information based only on a quarterly time frame. I believe the information AGNC provides within this slide is somewhat vague. It is inadequate when trying to calculate a projected BV figure. Therefore, I perform a more detailed quarterly BV calculation/analysis. After AGNC reports the company's quarterly results, I then compare my recalculated quarterly (ACTUAL) BV to AGNC's roll forward slide. This ensures there are no variances between the two sets of BV figures.
Table 2 - AGNC Nine-Months Ended BV Projection (BV as of 9/30/2014)
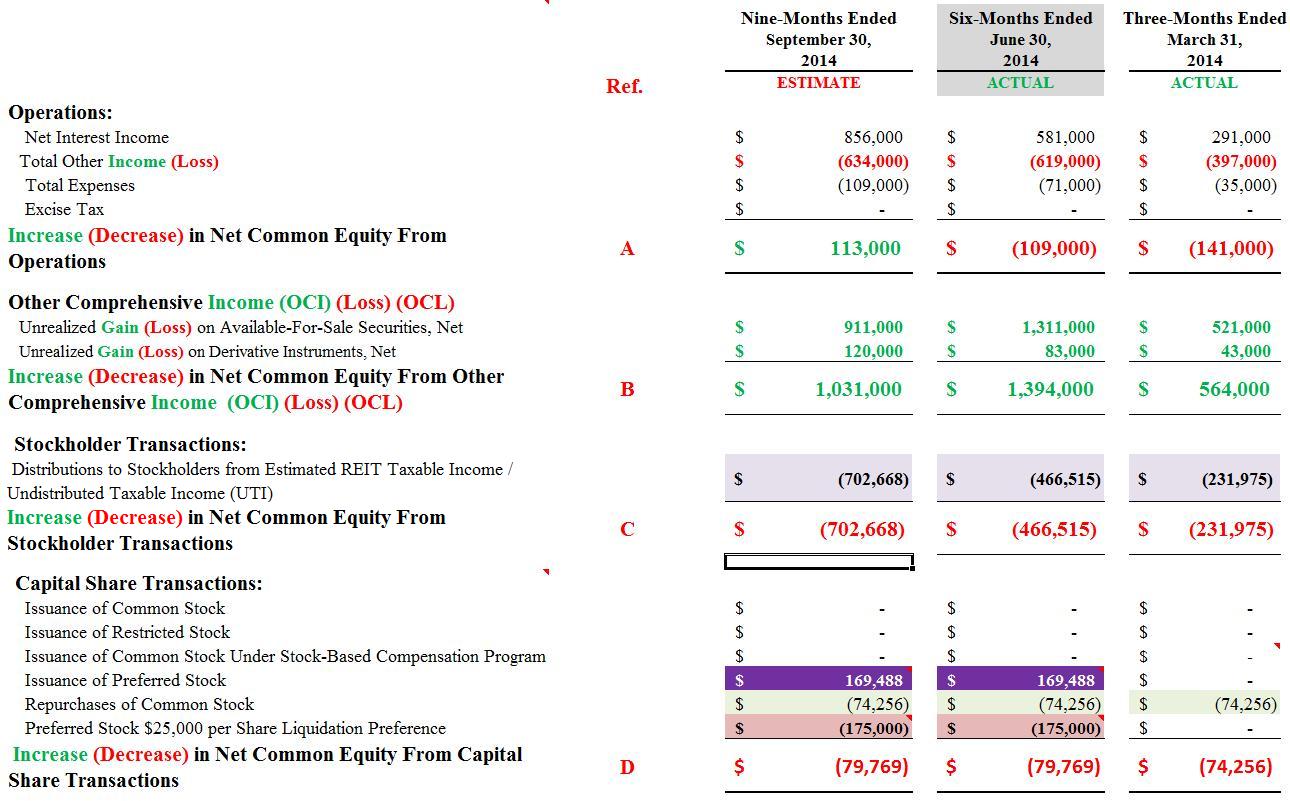
(Source: Table created entirely by myself, including all calculated figures and projected valuations)
Using Table 2 above as a reference, let us take a look at the calculation for AGNC's projected BV as of 9/30/2014. Unless otherwise noted, all figures below are for the "nine-months ended" time frame. Let us look at the following figures (in corresponding order to the "Ref." column shown in Table 2 next to the September 30, 2014 column):
A) Operations
B) Other Comprehensive Income (Loss) (OCI/(OCL))
C) Stockholder Transactions
D) Capital Share Transactions
A) Operations:
- Increase (Decrease) in Net Common Equity From Operations Estimate of $113 Million; Range ($237) - $463 Million
- Confidence Within Range = Moderate-to-High
- See Red Reference "A" in Table 2 Above, Next to the September 30, 2014 Column
This "net increase (decrease) in net common equity from operations" figure consists of the following amounts that come directly from AGNC's consolidated statement of comprehensive income (see Tables 1 and 2 above): 1) net interest income; 2) total other income (loss); 3) total expenses; and 4) excise tax.
Due to the fact I discussed these amounts in my previous three-part AGNC consolidated statement of comprehensive income projection article (see links near the top of this article), I will not delve into the details on how I obtained these figures. As such, further discussion of this figure is unwarranted.
B) Other Comprehensive Income (Loss) (OCI/(OCL)):
- Increase (Decrease) in Net Common Equity From Other Comprehensive Income (Loss) (OCI/(OCL)) Estimate of $1.03 Billion; Range $681 Million - $1.38 Billion
- Confidence Within Range = Moderate-to-High
- See Red Reference "B" in Table 2 Above, Next to the September 30, 2014 Column
This "net increase (decrease) in net common equity from OCI/(OCL)" figure consists of the following accounts that come directly from AGNC's consolidated statement of comprehensive income (see Tables 1 and 2 above): 1) unrealized gain (loss) on available-for-sale ("AFS") securities, net; and 2) unrealized gain (loss) on derivative instruments, net (upon reclassification to interest expense).
Due to the fact I discussed these accounts in my previous three-part AGNC consolidated statement of comprehensive income article (see links near the top of this article), I will not delve into the details on how I obtained these figures. As such, further discussion of this figure is unwarranted as well.
C) Stockholder Transactions:
- Increase (Decrease) in Net Common Equity From Stockholder Transactions Estimate of ($703) Million; Range ($718) - ($688) Million
- Confidence Within Range = High
- See Red Reference "C" in Table 2 Above, Next to the September 30, 2014 Column
This "net increase (decrease) in net common equity from stockholder transactions" figure is AGNC's dividend distributed for the first and second quarters of 2014 and payable for the third quarter of 2014. This figure includes the following types of outstanding shares of stock: 1) common; and 2) preferred.
1) Common Stock:
a) First Quarter of 2014:
The common stock dividend for the first quarter of 2014 was $0.65 per share. This was the second consecutive quarter where AGNC had distributed a quarterly dividend of $0.65 per share. AGNC had common stock dividend distributions of ($229.3) million for the first quarter of 2014 (or through the three months ended 3/31/2014).
b) Second Quarter of 2014:
The common stock dividend for the second quarter of 2014 was $0.65 per share. This was the third consecutive quarter where AGNC had distributed a quarterly dividend of $0.65 per share. AGNC had common stock dividend distributions of ($229.3) million for the second quarter of 2014.
c) Third Quarter of 2014:
Prior to projecting AGNC's common stock dividend distributions for the third quarter of 2014, let us first discuss how the number of the company's outstanding shares of common stock could change during any given quarter. AGNC has three programs which could affect the number of outstanding shares of common stock when quarterly dividends are declared.
AGNC's "at-the-market offering program" enables the company to publicly offer and sell a certain aggregate number of shares of common stock in privately negotiated transactions pursuant to the sales agreement with Mitsubishi UFJ Securities. AGNC has not exercised the company's right to use this offering program for nearly two years. Furthermore, since AGNC's stock price continued to trade below my projected "CURRENT BV" per share figure throughout the third quarter of 2014 (which I updated weekly), I am assuming no additional shares were issued under the company's at-the-market offering program.
AGNC also sponsors a "dividend reinvestment and direct stock purchase program". This plan allows AGNC's shareholders to acquire additional shares of common stock by reinvesting some or all of the cash dividends received. AGNC's shareholders may also make optional cash purchases of the company's common stock subject to certain limitations detailed in the plan's prospectus. The last time activity occurred within this program was in the first quarter of 2011. As was the case with AGNC's at-the-market offering program, I am making the assumption there was no activity in regards to this plan for the third quarter of 2014. It is in a shareholder's best interest that AGNC only issues additional shares of common stock when the issuance price would be accretive to BV. Any common stock issuance performed during the third quarter of 2014 would have been contrary to this notion.
The third program that could affect the number of outstanding shares of common stock is AGNC's "stock repurchase program". This program, which was created in October 2012, originally allowed AGNC to repurchase up to $1.0 billion of the company's outstanding shares of common stock through 12/31/2013. Several quarters ago, this program was amended to allow AGNC to repurchase up to $2.0 billion of the company's outstanding shares of common stock through 12/31/2014. As of 6/30/2014, AGNC had $992 million remaining under the company's stock repurchase program. AGNC intends to buy back outstanding shares of common stock only when the repurchase price is materially accretive to BV. When AGNC declared dividend distributions for the third quarter of 2014, the company did not mention it repurchased any outstanding shares of common stock during the current quarter (unlike in past quarters, where repurchased shares were disclosed). Since this statement was made on 9/18/2014, AGNC most likely did not repurchase any outstanding shares of common stock from 9/19/2014 through 9/30/2014, because that period of time would be considered a "closed window period".
By taking all of the assumptions above into consideration, I am projecting the number of outstanding shares of common stock as of 9/26/2014 (ex-dividend date) remained at 352.8 million. The common stock dividend declared for the third quarter of 2014 was $0.65 per share. This was an unchanged common stock dividend when compared to the second quarter of 2014. As such, the following calculation is determined:
Outstanding Shares of Common Stock as of 9/26/2014: 352.8 million
(*) Third Quarter of 2014 Dividend Payable: $0.65 per share
(=) Distributions to Common Shareholders: ($229.3) million
As such, I am projecting AGNC's dividend distributions to common shareholders were ($688) million for the nine months ended 9/30/2014. Now let us project the preferred stock dividend distributions.
2) Preferred Stock:
a) First Quarter of 2014:
The preferred stock dividend for the first quarter of 2014 was $0.50 per share. This was the eighth consecutive quarter where AGNC had distributed a quarterly dividend of $0.50 per share. AGNC had preferred stock dividend distributions of ($3.5) million for the first quarter of 2014 (or through the three months ended 3/31/2014).
b) Second Quarter of 2014:
The dividend declared on AGNC's "Series A Preferred Stock" for the second quarter of 2014 was $0.50 per share. This was the ninth consecutive quarter where AGNC had distributed a quarterly dividend of $0.50 per share. AGNC had a 7 million "depository share" issuance (each representing a 1/1,000th interest in a share of 7.750% Series B Cumulative Redeemable Preferred Stock) during the second quarter of 2014. This will be termed AGNC's "Series B Preferred Stock". The dividend declared on AGNC's Series B Preferred Stock for the second quarter of 2014 was $0.36059 per share (prorated dividend). This was the first quarter where AGNC had distributed a quarterly dividend on the company's Series B Preferred Stock. When combined, AGNC had preferred stock dividend distributions of ($5.9) million for the second quarter of 2014.
c) Third Quarter of 2014:
The dividend declared on AGNC's Series A Preferred Stock for the third quarter of 2014 was $0.50 per share. This was an unchanged dividend when compared to the second quarter of 2014. There were still 6.9 million outstanding shares of Series A Preferred Stock as of 9/29/2014 (ex-dividend date). As such, the following calculation is determined:
Outstanding Shares of Series A Preferred Stock as of 9/29/2014: 6.9 million
(*) Third Quarter of 2014 Dividend Payable: $0.50 per share
(=) Distributions to Series A Preferred Shareholders: ($3.5) million
The dividend declared on AGNC's Series B Preferred Stock for the third quarter of 2014 was $0.484375 per share. This was the first non-prorated dividend for the Series B Preferred Stock. There were still 7.0 million outstanding shares of Series B Preferred Stock as of 9/29/2014 (ex-dividend date). As such, the following calculation is determined:
Outstanding Shares of Series B Preferred Stock as of 9/29/2014: 7.0 million
(*) Third Quarter of 2014 Dividend Payable: $0.484375 per share
(=) Distributions to Series B Preferred Shareholders: ($3.4) million
Therefore, I am projecting AGNC's dividend distributions to preferred shareholders (Series A and B) were ($6.9) and ($16.3) million for the third quarter of 2014 and nine months ended 9/30/2014, respectively.
After combining the common and preferred stock dividend distributions for the first, second, and third quarters of 2014, I am projecting AGNC's total "distributions to stockholders from estimated REIT taxable income/undistributed taxable income ('UTI')" were ($703) million (rounded) for the nine months ended 9/30/2014. Therefore, I am projecting AGNC had an increase (decrease) in net common equity from stockholder transactions of ($703) million for the nine months ended 9/30/2014 (see red reference "C" in Table 2 above).
D) Capital Share Transactions:
- Increase (Decrease) in Net Common Equity From Capital Share Transactions Estimate of ($80) Million; Range ($130) - ($30) Million
- Confidence Within Range = High
- See Red Reference "D" in Table 2 Above, Next to the September 30, 2014 Column
As stated earlier, I am making the assumption no additional shares of common stock were issued under AGNC's at-the-market offering, dividend reinvestment, or direct stock purchase programs during the third quarter of 2014. Also, since there were no additional common stock equity offerings during the third quarter of 2014, the following figures should have no activity: 1) "issuance of common stock"; 2) "issuance of restricted stock"; and 3) "issuance of common stock under stock-based compensation program".
AGNC had a 7 million depository share issuance during the second quarter of 2014 (equivalent to 7,000 shares of Series B Preferred Stock). Gross proceeds of $203 million (or $25.00 per share) were raised from the depository share issuance. After the underwriter's discount, net proceeds were $24.2125 per share. When calculated, I am projecting an unchanged "issuance of preferred stock" figure of $169.4 million for the nine months ended 9/30/2014.
The liquidation preference of the depository shares is $25.00 per share. When calculated, I am projecting an unchanged "preferred stock $25,000 per share liquidation preference" figure of ($175) million for the nine months ended 9/30/2014. This amount needs to be reversed out of Table 2, due to the fact this issuance was in relation to preferred stock and this analysis is projecting AGNC's BV per common share.
Regarding AGNC's "repurchases of common stock" figure, I am making the assumption AGNC did not repurchase any outstanding shares of common stock under the company's stock repurchase program during the third quarter of 2014 (as discussed earlier). Therefore, this amount will remain unchanged at ($74) million for the nine months ended 9/30/2014.
Therefore, I am projecting AGNC had an increase (decrease) in "net common equity from capital share transactions" of ($80) million for the nine months ended 9/30/2014 (see red reference "D" in Table 2 above).
Remainder of BV Calculation:
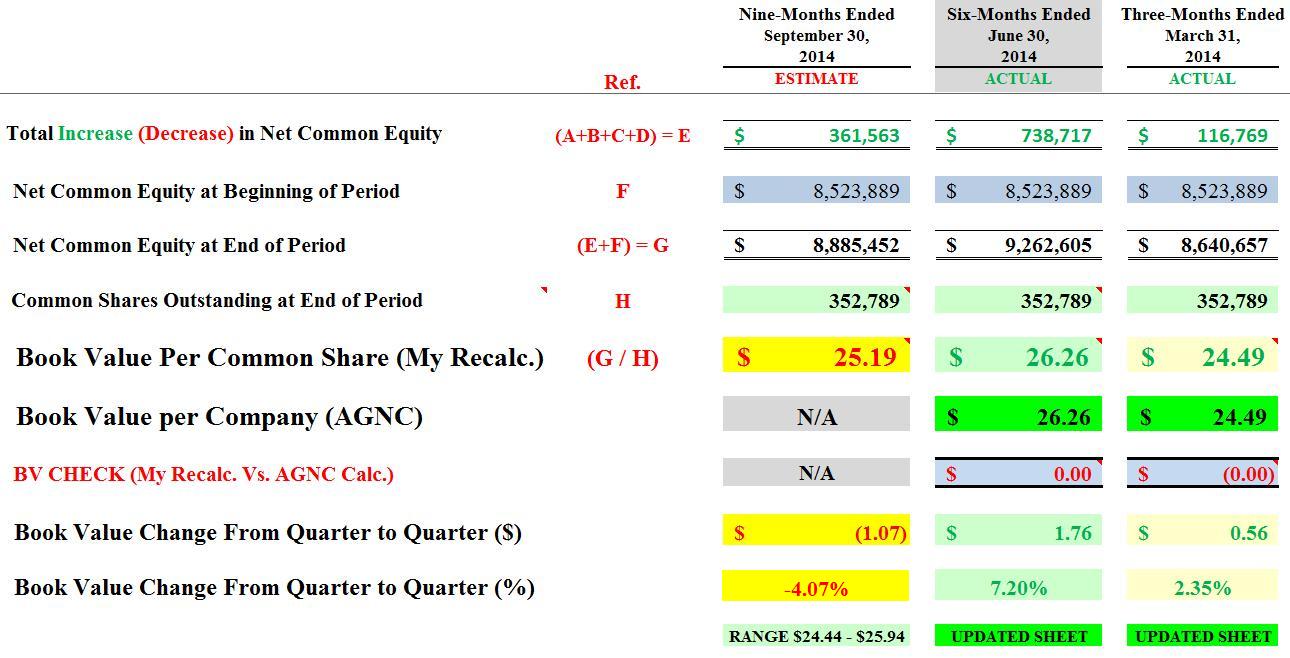
After adding up the four referenced figures discussed above (see red references "A, B, C, D" in Table 2 above), I am projecting AGNC had a "total increase (decrease) in net common equity" of $362 million for the nine months ended 9/30/2014 (see red reference "(A+B+C+D) = E" in Table 2 above).
Having this figure established, let us now calculate AGNC's projected BV per common share as of 9/30/2014 (see red references "E, F, G, H" in Table 2 above):
Total Increase (Decrease) in Net Common Equity: $362 million
(+) Net Common Equity at Beginning of Period: $8.52 billion
(=) Net Common Equity at End of Period: $8.89 billion
(/) Outstanding Shares of Common Stock as of 9/30/2014: 352.8 million
(=) BV Per Common Share as of 9/30/2014: $25.19
Brief Discussion of MTGE's Projected BV as of 9/30/2014:
When compared to AGNC, I am projecting MTGE had a similar proportional BV per share decrease (percentage wise) for the third quarter of 2014. Each company's agency MBS and derivative portfolios were fairly similar as of 6/30/2014. The only material difference between each company's MBS portfolio was the fact MTGE also had a minor non-agency MBS portfolio as of 6/30/2014. MTGE's non-agency MBS portfolio modestly underperformed when compared to the company's agency MBS portfolio during the second quarter of 2014. MTGE had a total non-agency MBS portfolio of $1.036 billion as of 3/31/2014. This balance increased (decreased) by $15 million to $1.051 billion as of 6/30/2014. When compared to MTGE's agency MBS portfolio of $5.6 billion, management increased (decreased) the proportional share of the company's non-agency MBS portfolio by 0.31% during the second quarter of 2014. Due to the flat-to-slight appreciation in real estate prices, including the continued flat-to-slight decrease in mortgage delinquencies and foreclosures, most non-agency MBS should slightly outperform agency MBS during the third quarter of 2014.
MTGE has also begun to "ramp up" operations regarding the company's recently acquired mortgage servicer, Residential Credit Solutions ("RCS"). As of 3/31/2014, MTGE's fair market value ("FMV") of the company's mortgage servicing rights ("MSR") was $38.5 million. This balance materially increased to $106.2 million as of 6/30/2014. While results within RCS have been less than "ideal" over the past several quarters (reported several slight losses), I am projecting MTGE will begin to "turn the tide" within this subsidiary as valuations continue to increase in this specific sector. As such, I anticipate MTGE will start to post quarterly profits within RCS soon. This should have a minor positive impact on earnings and BV during the third quarter of 2014.
When taking all quarterly activities into consideration (including additional data not included within this article), I am projecting MTGE will report the following BV per common share as of 9/30/2014:
MTGE's Projected BV as of 9/30/2014 = $21.95 Per Common Share
MTGE's Projected BV Range as of 9/30/2014 = $21.20 - $22.70 Per Common Share
Brief Discussion of NLY's Projected BV as of 9/30/2014:
When compared to AGNC, I am projecting NLY had a slightly less proportional BV per share decrease (percentage wise) for the third quarter of 2014. As was highlighted in my three-part AGNC consolidated statement of comprehensive income projection article (see links near the top of this article), I had discussed certain subtle differences in each company's agency MBS portfolio. Furthermore, each company had a different strategy regarding derivative instruments going into the third quarter of 2014. I will note a few of these differences.
AGNC and NLY had a material difference in each company's TBA MBS position as of 6/30/2014. AGNC had a net long (short) TBA MBS position of $17.8 billion as of 6/30/2014. In sharp contrast, NLY had a net long (short) TBA MBS position of ($0.7) billion as of 6/30/2014. NLY's management team has continued to state the company continues to see the attractiveness of specified pools versus the TBA forward market.
Second, AGNC and NLY had materially different hedging coverage ratios as of 6/30/2014. AGNC had a hedging coverage ratio of 88% as of 6/30/2014. In sharp contrast, NLY only had a hedging coverage ratio of 47% as of 6/30/2014. NLY had a net long (short) interest rate swaps position of ($30.8) billion as of 6/30/2014. This was a net (short) (increase) decrease of $25.9 billion, or 46% of NLY's interest rate swaps net long (short) position of ($56.7) billion as of 3/31/2014. Equally important, NLY did not increase the company's net (short) interest rate swaption balance or utilize (short) U.S. Treasury security positions to offset the material reduction of its interest rate swaps net (short) position. As of 6/30/2014, NLY was inherently more vulnerable if mortgage interest rates/U.S. Treasury yields rapidly increased during the third quarter of 2014. However, it should also be noted this specific scenario did not occur. This should benefit NLY's results for the third quarter of 2014 (when compared to AGNC).
When taking all quarterly activities into consideration (including additional data not included within this article), I am projecting NLY will report the following BV per common share as of 9/30/2014:
NLY's Projected BV as of 9/30/2014 = $12.80 Per Common Share
NLY's Projected BV Range as of 9/30/2014 = $12.40 - $13.20 Per Common Share
Conclusions Drawn:
To sum up all the information discussed above, I am projecting AGNC will report the following BV per common share as of 9/30/2014:
AGNC's Projected BV as of 9/30/2014 = $25.19 Per Common Share
AGNC's Projected BV Range as of 9/30/2014 = $24.44 - $25.94 Per Common Share
This projection is a ($1.07) per common share increase (decrease) from AGNC's BV as of 6/30/2014. This decrease can be attributed to two factors.
The first factor is in relation to the activity within AGNC's consolidated statement of comprehensive income. I am projecting AGNC reports net income (loss) of $222 million for the third quarter of 2014. This calculates to a projected increase (decrease) in quarterly BV of $0.61 per share (does not back out the preferred stock dividend to avoid double counting; already backed out in BV calculation above). I am also projecting the company reports OCI/(OCL) of ($363) million for the third quarter of 2014. This calculates to a projected increase (decrease) in quarterly BV of ($1.03) per share. When AGNC's net income (loss) and OCI/(OCL) figures are combined, I am projecting a comprehensive income (loss) of ($141) million for the third quarter of 2014. This calculates to a projected increase (decrease) in quarterly BV of ($0.42) per share (again, does not back out the preferred stock dividend to avoid double counting; already backed out in BV calculation above).
The second factor is in relation to the activity within AGNC's equity section of the balance sheet. AGNC had an accrual for quarterly dividend distributions of ($0.65) per common share during the third quarter of 2014.
When combined, these two factors account for a projected quarterly BV increase (decrease) of ($1.07) per common share. Therefore, when compared to 6/30/2014, I am projecting AGNC will report a modest decrease in BV per common share as of 9/30/2014. I believe the market will take this as a negative sign, because this would mean AGNC's BV per common share had an increase (decrease) of (4.07%) during the third quarter of 2014. In addition, this would mean AGNC generated an "economic return (loss)" (dividends accrued for and net change in BV) of (1.60%) for the third quarter of 2014.
The option-adjusted spread ("OAS") between most fixed-rate agency MBS coupons and interest rate swap rates/U.S. Treasury yields narrowed during the third quarter of 2014. Even though longer-termed interest rate swaps/U.S. Treasury yields were relatively flat for the third quarter of 2014, cumulative quarterly MBS prices decreased throughout most of the 15- and 30-year fixed-rate agency coupons. The type of scenario that occurred during the third quarter of 2014 is an inherent risk that is always possible in the mREIT sector and is termed "spread/basis risk". This will always be a risk one needs to continually monitor as future economic data is presented.
With that being said, mortgage interest rates/U.S. Treasury yields have sharply "reversed-course" during the first half of October 2014. As such, MBS prices across most 15- and 30-year fixed-rate agency coupons are currently materially higher when compared to prices as of 9/30/2014. However, partially mitigating this positive piece of data is the materially lower valuations regarding most interest rate swaps, swaptions, and U.S. Treasury securities. Therefore, there is a fairly high probability AGNC's, MTGE's, and NLY's CURRENT BV is at least slightly-to-modestly higher than each company's respective BV as of 9/30/2014. Readers should understand this notion as mREIT companies begin to provide results for the third quarter of 2014. I currently project AGNC's BV as of 10/17/2014 was approximately $0.25-$0.50 per common share higher than BV as of 9/30/2014.
Currently, even with my projected modest decrease to BV for the third quarter of 2014, I believe AGNC is attractively priced at $22.96 per share as of 10/22/2014. I currently rate AGNC, MTGE, and NLY as a SOLID HOLD when I believe the companies' stock prices are trading at a minor-to-modest (under 10%) discount to CURRENT BV and a BUY when trading a material (at or over 10%) discount to CURRENT BV. As such, I currently rate AGNC, MTGE, and NLY as a SOLID HOLD/BUY, since each stock is trading either near or slightly above a material discount to CURRENT BV (BV as of 10/17/2014).
Final Note: Each investor's BUY, SELL, or HOLD decision is based on one's risk tolerance, time horizon, and dividend income goals. My personal recommendation may not fit each reader's current investing strategy.