The last time I analyzed Duke Energy (NYSE:DUK) on September 22, 2014, I stated, "I still like the company but I'm not going to be purchasing anymore shares at this time and actually going to wait a couple of months." Since the article was published, the stock has increased 7.22% versus the 2.99% drop the S&P 500 (SPY) posted. Unfortunately I didn't purchase any shares to realize that gain. Duke Energy Corp. is an energy company, operating through its direct and indirect wholly owned subsidiaries.
On August 7, 2014, the company reported second quarter earnings of $1.11 per share, which beat the consensus of analysts' estimates by $0.13. In the past year the company's stock is up 11.21% excluding dividends (up 15.61% including dividends) and is losing to the S&P 500, which has gained 11.67% in the same timeframe. Since initiating my position back on May 28, 2013, I'm up 13.97% inclusive of reinvested dividends and dollar cost averaging. With all this in mind, I'd like to take a moment to evaluate the stock to see if right now is a good time to purchase more for the utilities sector of my portfolio.
Fundamentals
The company currently trades at a trailing 12-month P/E ratio of 25.86, which is fairly priced, but I mainly like to purchase a stock based on where the company is going in the future as opposed to what it has done in the past. On that note, the 1-year forward-looking P/E ratio of 16.81 is currently fairly priced for the future in terms of the right here, right now. The 1-year PEG ratio (7.08), which measures the ratio of the price you're currently paying for the trailing 12-month earnings on the stock while dividing it by the earnings growth of the company for a specified amount of time (I like looking at a 1-year horizon), tells me that the company is expensively priced based on a 1-year EPS growth rate of 3.65%. Below is a comparison table of the fundamental metrics for the company for when I wrote all articles pertaining to the company.
Article Date | Price ($) | TTM P/E | Fwd P/E | EPS Next YR ($) | Target Price ($) | PEG | EPS next YR (%) |
15Aug13 | 69.02 | 24.56 | 15.14 | 4.56 | 68 | 4.42 | 2.19 |
06Oct13 | 66.43 | 23.73 | 14.58 | 4.56 | 68 | 4.21 | 5.63 |
07Nov13 | 72.92 | 26.04 | 16.01 | 4.56 | 68 | 4.44 | 5.86 |
23Feb14 | 71.49 | 21.28 | 15.06 | 4.75 | 71 | 5.08 | 4.19 |
26May14 | 70.28 | 25.84 | 14.78 | 4.76 | 71 | 6.93 | 3.73 |
14Aug14 | 72.08 | 26.5 | 15.14 | 4.76 | 71 | 6.48 | 4.09 |
21Sep14 | 74.38 | 23.99 | 15.60 | 4.77 | 72 | 6.53 | 3.67 |
23Oct14 | 79.78 | 25.86 | 16.81 | 4.77 | 72 | 7.08 | 3.65 |
Financials
On a financial basis, the things I look for are the dividend payouts, return on assets, equity and investment. The company pays a dividend of 3.97% with a payout ratio of 103% of trailing 12-month earnings while sporting return on assets, equity and investment values of 1.9%, 5.4% and 4.5%, respectively, which are all respectable values. Because I believe the market may get a bit choppy here and would like a safety play, I believe the 3.97% yield of this company is good enough for me to take shelter in for the time being. The company has been increasing its dividends for the past 10 years at a 5-year dividend growth rate of 2.7%. Below is a comparison table of the financial metrics for when I wrote all articles pertaining to the company.
Article Date | Yield (%) | Payout TTM (%) | ROA (%) | ROE (%) | ROI (%) |
15Aug13 | 4.52 | 92 | 2.1 | 5.8 | 3.0 |
06Oct13 | 4.70 | 111 | 1.8 | 4.9 | 3.0 |
07Nov13 | 4.28 | 111 | 1.8 | 4.9 | 3.0 |
23Feb14 | 4.36 | 93 | 2.1 | 5.9 | 3.0 |
26May14 | 4.44 | 115 | 1.7 | 4.7 | 4.5 |
14Aug14 | 4.33 | 115 | 1.7 | 4.7 | 4.5 |
21Sep14 | 4.28 | 103 | 1.9 | 5.4 | 4.5 |
23Oct14 | 3.97 | 103 | 1.9 | 5.4 | 4.5 |
Technicals
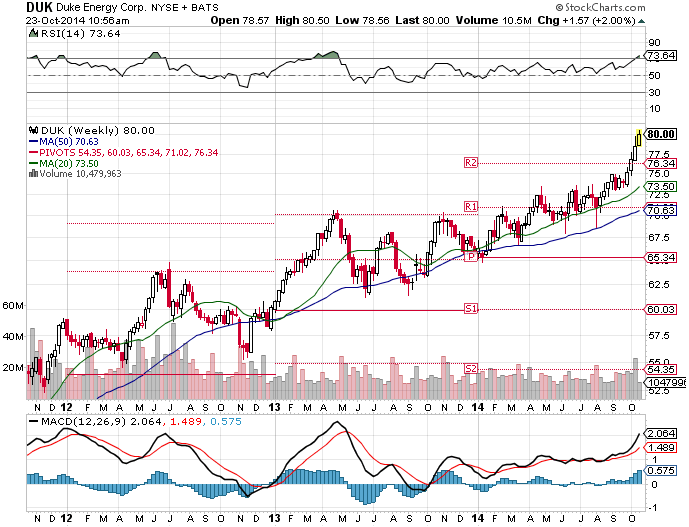 Looking first at the relative strength index chart [RSI] at the top, I see the stock in overbought territory with a current value of 73.64. I will look at the moving average convergence-divergence [MACD] chart next. I see that the black line is above the red line with the divergence bars increasing in height which tells me bullish momentum is in the name. As for the stock price itself ($79.78), I'm looking at $85 to act as resistance and $76.34 to act as support for a risk/reward ratio which plays out to be -4.58% to 6.25%.
52-Week Highs
While the market has been tanking for almost all of September and half of October, Duke has been rallying upwards, and been rallying pretty hard. The stock has been at its 52-week high and just keeps chugging higher. Duke continues to try and engineer a turnaround which should accelerate earnings and dividends higher into the future.
Conclusion
Fundamentally I believe the company to be fairly valued on next year's earnings estimates while expensively valued on earnings growth potential. Financially, the dividend is solid at this time. On a technical basis the risk/reward ratio shows me there is more reward than risk right now. I like the fact that the stock pays a solid dividend but it just has shot up way fast in my opinion and need to see a pullback in the name before I go buying more shares in the name.
Disclaimer: This article is in no way a recommendation to buy or sell any stock mentioned. This article is meant to serve as a journal for myself as to the rationale of why I bought/sold this stock when I look back on it in the future. These are only my personal opinions and you should do your own homework. Only you are responsible for what you trade and happy investing!