Still a lot of investors are looking for alpha these days. Either it's pure alpha in form of hedge funds or a mixture of beta and alpha from outperforming mutual funds. In contrast to that, money which is pouring into classical passive ETFs, which track public indices, is certainly not looking for any additional alpha. However, there are some alternative ETFs available which claim to provide alpha based on the unique index construction methodology, like Research Affiliate's RAFI 1000 Fundamental Index.
Alternative indexation has caught a lot of investors' interest in recent months. Beside Research Affiliate's Fundamental Indexing, which focuses on stock selection with a fundamental screen, there are a lot of ETFs available nowadays, which track equal weighted indices, e.g .the equal weighted versions of S&P 500 or Russell 2000 and 1000. Although equal weighted indices have historically provided investors higher returns than their respective benchmarks, these indices exhibit higher volatility and suffer higher drawdowns most of the time. On the bottom line, most of the equal weighted indices are not able to deliver a higher risk adjusted return than their respective benchmarks on a consistent manner.
Davis and Menchero demonstrate in a MSCI Bara research paper called "Risk Contribution Is Exposure Times Volatility Times Correlation," which was recently published in the Journal of Portfolio Management, an appealing way to decompose the risk of a portfolio. Based on that concept, one can easily build a portfolio where every constituent contributes the same amount of risk to the portfolio. Maillard, Roncalli and Teiletche describe the properties of such equally weighted risk contribution (ERC) portfolios in more detail in a recently published article in the Journal of Portfolio Management. They show that theoretically, the volatility of ERC portfolios is located between those of minimum variance and equally weighted portfolios, which they can prove empirically as well. The authors also find empirically that ERC portfolios exhibit a relative high return and a relative low drawdown compared to the other construction methodologies. Given their strong risk adjusted performance ERC Portfolios offer a good trade-off between return, volatility and diversification.
Technically, letting every asset contribute the same amount of risk to the total portfolio risk, is a special case in the world of risk budgeting. Let's try to beat the S&P 500 by constructing a portfolio of the Select Sector SPDRs, that divide the S&P 500 into nine sectors and contain just the constituents of the S&P 500 Index weighted by their market capitalization:
- The Consumer Discretionary Select Sector SPDR Fund - XLY
- The Consumer Staples Select Sector SPDR Fund - XLP
- The Energy Select Sector SPDR Fund - XLE
- The Financial Select Sector SPDR Fund - XLF
- The Health Care Select Sector SPDR Fund - XLV
- The Industrial Select Sector SPDR Fund - XLI
- The Materials Select Sector SPDR Fund - XLB
- The Technology Select Sector SPDR Fund - XLK
- The Utilities Select Sector SPDR Fund - XLU
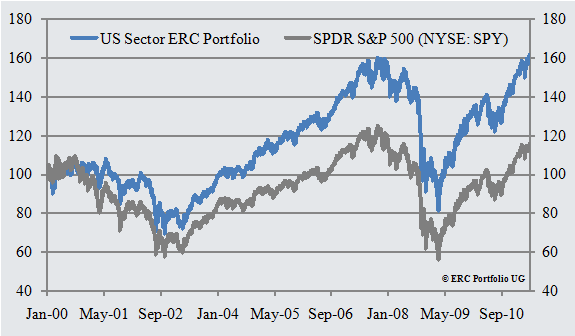
The portfolio is rebalanced every quarter so that every ETF contributes the same amount of risk to the total portfolio volatility. The chart below shows the results of a backtest of the ERC approach since the launch of the Select Sector SPDRs.
(Click to enlarge)
With an annualized return of 4.40% since Jan. 5, 2000, compared to 1.29% for the SPDR S&P 500 and a volatility of 18.93% (p.a.), which is almost 15% lower than the volatility of the SPDR S&P 500, the U.S. Sector ERC Portfolio exhibits a much better risk-adjusted return than the SPDR S&P 500. Its ytd-performance is at +7.64%, slightly below the 7.65% for the SPDR S&P 500, but its performance over the last year is at 15.13% compared to the performance of the SPDR S&P 500 standing at 13.33%. From a risk adjusted perspective the ERC Portfolio's Sharpe-Ratio over the last year of 0.912 is much higher than the Sharpe Ratio for the SPDR S&P 500 which is at 0.737. In addition to that the U.S. Sector ERC Portfolio made new all time highs on April 21st while the SPDR S&P 500 is still 8.16% below its all time high.
A look into Morningstar's Mutual Fund Database reveals that the average of the 810 Mutual Funds in the U.S. Stocks - Large-Cap Blend Category returned 2.84% p.a. over the last 10 years (date through 4/27/2011), while the S&P 500 recorded 2.73% p.a. The U.S. Sector Portfolio ERC, not just outperformed the mean of the peer group, instead it ended up almost in the 5%-percentile while comparing it with managers, having a tenure of at least 10 years, over the last 10 years. Actually, it would have made the 44th place in such a comparison with an annualized return of 4.80%, which is not bad for a passive indexation strategy.
Disclosure: I have no positions in any stocks mentioned, and no plans to initiate any positions within the next 72 hours.