The Fed takes a lot of heat for a lot of things. But credit should be given when credit is due. And the Fed deserves some credit for its brand new monthly Labor Market Conditions Index. The LMCI is a "dynamic factor model that extracts the primary common variation from 19 labor market indicators." In plain English, the Fed takes 19 labor market data points and compiles them into one index. In no particular order, the components underlying the index are:
Unemployment and Underemployment |
Unemployment rate |
Labor force participation rate |
Part time for economic reasons |
Employment |
Private payroll employment |
Government payroll employment |
Temporary help employment |
Workweeks |
Average weekly hours (production) |
Average weekly hours of persons at work |
Wages |
Average hourly earnings (production) |
Vacancies |
Composite help-wanted index |
Hiring |
Hiring rate |
Transition rate from unemployment to employment |
Layoffs |
Insured unemployment rate |
Job losers unemployed less than 5 weeks |
Quits |
Quit rate |
Job leavers unemployed less than 5 weeks |
Consumer and Business Surveys |
Jobs plentiful versus hard to get |
Hiring plans |
Jobs hard to fill |
Why should you care about this new way to track labor market conditions? Here's why: The LMCI is a useful indicator for predicting recessions. How good is it? Let's take a look.
The Fed backtested the LMCI using data from July 1976 on. Since 1976, the U.S. has had five recessions. Preceding each of those recessions, the LMCI dropped below zero. As the chart below shows, not every time the LMCI drops below zero does it mean a recession is on the horizon. But every time there is a recession, it is preceded by the LMCI dropping below zero.
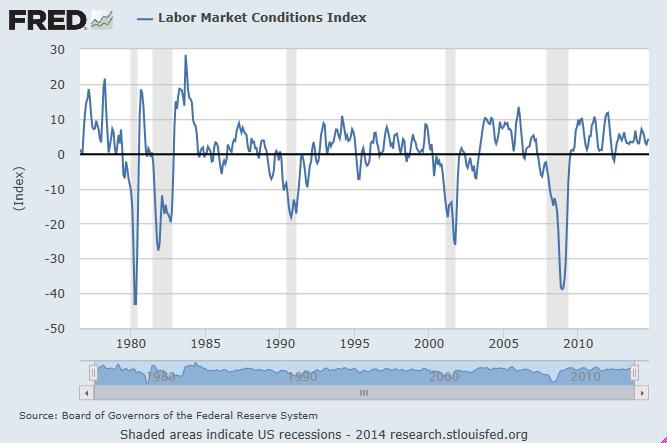
Where does the index stand today? At this time, the index sits at 4.0, down from its January 2012 cycle high of 11.8.
On a final note, you may be wondering when the latest number is released and where to find it. The index, which debuted last month, is currently scheduled to be released on the first business day following the Bureau of Labor Statistics' monthly Employment Situation report. You can find the latest data here.