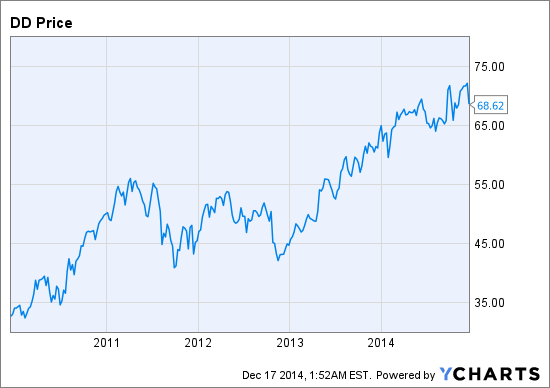
As the largest publicly traded American chemical company, E. I. du Pont de Nemours and Company (NYSE:DD) is one of the few stocks in the basic materials sector that has a solid dividend growth track record. DuPont has delivered impressive long-term returns for its shareholders (+100% over the last five years), but the stock's forward valuation is now at its highest level at any point during this time. Nevertheless, analysts expect that the firm's earnings growth will accelerate over the coming years and the company achieves a higher return on invested capital than its largest competitors. This article investigates DuPont in detail to determine whether it is worthy of its current earnings multiple or if the stock's best days are behind it.
Please click here to read my article, which outlines the DRAG analysis framework in more detail.
To summarize, the four variables used in a DRAG (dividend and risk adjusted growth) analysis are as follows (each company is ranked from 0 to 3 in each category):
1) How cyclical is the industry in which DuPont operates?
2) How strong is DuPont's competitive position within this industry?
3) How risky is DuPont's balance sheet?
4) What is DuPont's dividend yield and dividend growth history?
The premise is that a company that operates in a non-cyclical industry, with a strong competitive position and a clean balance sheet that pays an attractive dividend should trade at a higher earnings multiple than a company without these attributes, even if the lower quality company has higher projected future earnings growth. After adjusting for these variables, it becomes easier to compare companies in different sectors with different levels of future growth potential.
DuPont DRAG Analysis:
DuPont Industry Analysis | |
Industry Beta | 1.42 |
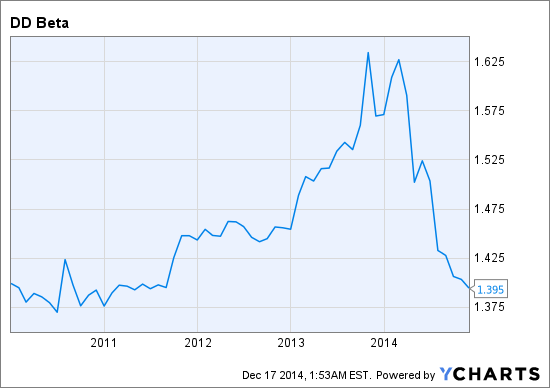
Stock Beta | 1.40 |
10 Year EPS Std Dev | 41.2% |
Industry Score | 0.5/3 |
According to several different sources, the chemical industry possesses significant economic sensitivity. A research website from NYU's Stern School of Business suggests that the average diversified chemical stock has a beta of 1.42 and the Materials Select Sector SPDR (XLB) (which lists shares of DuPont as its largest holding) has a beta of 1.32 according to Google Finance. Over the last five years, DuPont's shares have also exhibited well above average volatility and currently possess a beta similar to that of its sector:
The company's annual earnings have been fairly volatile, declining four times over the last decade. This elevated level of cyclicality will always be a risk for DuPont's shareholders and causes the stock to earn a well below average score in this portion of the DRAG framework.
DuPont Competitive Position Analysis | |
Gross Margin | 38.8% |
Operating Margin | 12.7% |
Return on Assets | 6.3% |
Return on Invested Capital | 11.9% |
Competitive Position Score | 1.5/3 |
Comparing different chemical companies is challenging because each firm manufactures a different mix of products with highly variable levels of profitability. However, DuPont's current gross margin is the highest this metric has been in the last decade and its operating margin has also improved in recent years. While DuPont's return on assets of less than 7% is not particularly inspiring and its return on invested capital has fallen in recent quarters, its ROIC remains ahead of two of its largest competitors (Dow Chemical (DOW) and Air Products and Chemicals (APD)):
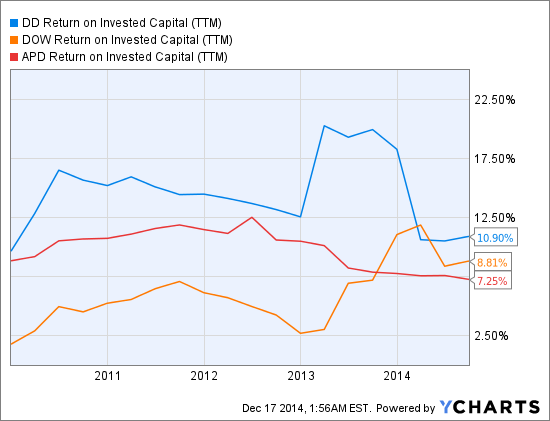
Over the last decade, DuPont has averaged an ROIC of greater than 16%, which suggests that the firm's competitive position has remained fairly strong during this period. Despite the recent decline in this metric, the company still warrants an average rating in this section of the analysis.
DuPont Balance Sheet Analysis | |
Debt to Equity Ratio | 0.59 |
Current Ratio | 1.74 |
Interest Coverage | 11.4 |
Balance Sheet Score | 1.5/3 |
DuPont's balance sheet is not remarkable in any area, but the company's financial position should not concern its shareholders. Compared to its $63 billion market capitalization, the firm's $13 billion in total debt outstanding is not overly problematic and is partially offset by a cash position of $4.5 billion. Its debt to equity ratio has fallen in recent years (it was over 1 as recently as 2012) and the company covers its interest payments comfortably. The aforementioned cyclicality present in the chemical industry suggests that firms such as DuPont should maintain flexible balance sheets and the company's management appears to have it well positioned for success moving forward.
DuPont Dividend Analysis | |
Current Yield | 2.7% |
Payout Ratio | 54.0% |
1 Year Dividend Growth | 4.4% |
3 Year Dividend Growth | 14.6% |
Dividend Score | 1.5/3 |
With a dividend yield approaching 3%, DuPont offers shareholders an above average level of income and has a solid, if unspectacular dividend growth history. After leaving its dividend unchanged between 2008 and 2011, the company has since announced three dividend increases ($0.02 per share each time). The firm has generated a similar level of free cash flow to net earnings over the past five years and has returned a reasonable amount of these funds to shareholders in the form of both dividends and share buybacks. While some investors might wish to see more significant levels of dividend growth, DuPont is a solid income stock in the materials sector.
DuPont DRAG Analysis | |
Total DRAG Score | 5 |
/4 = Average DRAG Score | 1.25 |
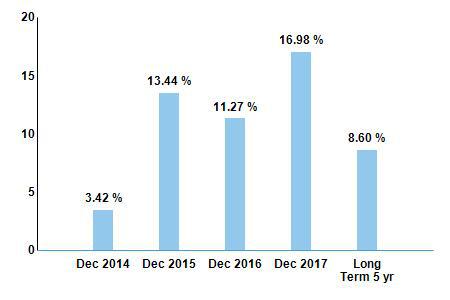
x Projected LT EPS Growth Rate | 8.60% |
x Projected 2015 EPS | |
= DuPont Target Price | $48.38 |
There are several reasons why the DRAG framework is not especially fond of DuPont at its current price. First, although earnings growth is expected to accelerate in upcoming years, the anticipated long-term growth rate remains below 10%:
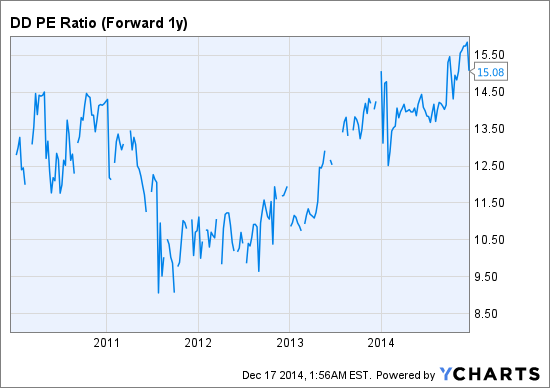
DuPont operates in a cyclical industry, has a reasonable balance sheet and a slightly above average dividend yield, but its valuation appears stretched when compared to its earnings growth outlook. While the above $48 target price is nearly 30% lower than the stock's current price ($69), it would imply a forward earnings multiple of approximately 11, which is not unprecedented for the company:
Put simply, neither DuPont's fundamental attributes nor its current valuation suggest that this stock is one that one should include in his or her portfolio. If the company's earnings growth forecast improves or its valuation moves back closer to its historical average it would likely become more attractive, but until that occurs, DuPont is not a stock worth owning.