Since our last write-up, Pier 1 Imports (PIR) has experienced a fall down to the $12 level (our updated low-end target) and rallied back off strong results. In addition, the company recently announced that it will be a net closer of stores in Q4, which we believe to be the beginning of a store rationalization plan due to the strong performance of the e-commerce platform. With the updated information of the last 6-9 months, we believe it is time to update and provide our 2-3 year price target of 80% upside. We have also included updated pro-forms and sensitivity analysis for investors. Overall, we are happy with the progress and believe in the long-term story.
Pier 1 Imports : Long Recommendation
We believe that Pier 1 Imports has faced negative sentiment from investors (trading at ~12.5x forward earnings) and sell-side analysts (avg. price target of ~$16 with consensus HOLD rating) due to intermediate-term margin concerns due to a highly promotional environment, higher near-term costs associated with e-commerce growth, and near-term top-line sales skepticism. But, taking a longer-term approach, we see a company that is successfully executing on its strategy to build a strong omni-channel presence through e-commerce and its Express Request service, reaching e- commerce scale (>20% of total sales) over the next 12 months with should allow the company to leverage its recent investments. Starting next year, the company will begin rolling off of a large capital investment plan that should allow for greater free cash flow generation, cutting back its promotional activity, and in our opinion, about to embark on a store rationalization plan that should support margin expansion and improved operating performance going forward.
As these catalysts kick in over the next 2-3 years, we see free cash flow generation increasing to ~$120-150MM. We believe that this will result in either 1) a re-rating of stock or 2) a sustainably high level of returns of capital (~10% of market capitalization annually) that includes increases to its dividend (current 1.5% yield) and enhanced share repurchase activity. We believe that improving operating performance, combined with share repurchase activity, will enable the company to reach ~$1.65-2.00 per share in earnings power and $270-300MM in EBITDA over the next 36 months. Using normalized valuation metrics to account for improving performance as compared to current multiples based on market skepticism, we arrive at a price target of $25-30, equaling 70-100% upside over the next three years.
Business Overview
Pier 1 Imports is one of the leading home furnishing retailers in the US, specializing in imported home furnishings and décor, decorative accessories, and seasonal items. During the depths of the recession, the company almost went bankrupt, and started to cut costs in order to improve profitability. Over the last two years as its liquidity position has drastically improved, the company re-entered growth mode and has been taking steps to revitalize its business and return capital to shareholders. The company's main business is it retail (physical store) business, but major investments over the last several years have been centered on growing its omni-channel platform and revitalizing a portion of its store base. After CY2014, these investments begin to roll off (capex will now normalize) and will now begin to be realized in greater significance.
Additionally, the company should benefit from mean reversion trends in the housing market and normalized furniture spending as a percentage of consumer spending (see appendix for detailed information), which should help support mid-single-digit growth for years to come. When looking at consensus estimates, analysts seems to be focusing on the margins of the business (consensus estimates for revenues are in-line, but operating margins are lower) so we will be focusing on this piece of the operating model in more depth during this pitch.
1 Pier 1 Plan Reaches Scale in 2015
The company has made major investments over the last few years ramping up an e-commerce platform as part of its omni-channel strategy. Though there were bumps in the road early on (in 2013 they faced some issues with the user experience on the website, which contributed to lower than expected sales), 2014 was a year on immense progress in this segment. The company's original goal for 2014 was to hit $100MM of sales through this platform, in the middle of the year they revised this target to $200MM, which they will now likely eclipse (the company should come in at $210-220MM after Q4 based on run rate Q3 and early Q4 results). This growth has been buoyed by a number of factors, including the company's Express Request re-launch (in-store catalog business), a new POS system that is now fully implemented, a "buy online pick up in store" program, by tripling the SKUs available online (which also helped benefit the Express Request program), and by bringing forward investments to build out its second fulfillment center.
There are several reasons why we expect the growth in e-commerce to continue including:
1. During 2013, the home category in e-commerce grew 15% year-over-year, which made it one of the fastest growing categories in all of retail, supporting strong adoption online
2. On a run-rate basis (last quarter), 25% of sales are coming from omni-channel
3. The company's new loyalty program has been one of the drivers of omni-channel growth. Launched last year, the loyalty program beat management's short-term penetration target of 30%, driving ~35% of sales through the program. (As e-commerce grows as a percentage of sales, we believe that high loyalty penetration will also provide a "moat" against online-only retailers)
4. For Pier 1, mobile purchase now outpace online purchases, showing strength in a platform that looks to be overtaking traditional online.
This is very important for Pier 1 because e-commerce sales become a significant differentiator in the home furnishing market - HomeGoods ($3B in annual sales) does not currently have an e-commerce platform, and Kirkland's, La-Z-Boy, and Ethan Allen (total about ~$3B in sales) have minimal e-commerce presence. In this essence, the business model begins to look a lot more like WSM than it does tradition retailer (overall, retail brands with strong catalog/e-commerce presence trend to command a higher multiple in today's market). Additionally, Customers who shop PIR both in-store and online spend nearly four times the average in-store only customers and in-home delivery (through e-commerce and Express Request) has an average ticket above $1000. Both of these should help drive sales productivity, which ranks last in the furniture industry, higher going forward.
Included in the mid-2014 guidance to raise e-commerce sales to $200MM, the company gave guidance of $400MM (20% of sales) for FY2016 (CY 2015). This is a very important level for the company, because the e-commerce business, which was the focus of year of investment and a recent headwind on margins, begins to leverage margins at the $400MM level. Operating margins currently fall in the ~9% range, but have historically (ex-recession period) feel in the ~11% range. We believe that ~100-150 bps of this delta is related to investments in e-commerce, which means that the company could begin to take this margin delta back as the business scales in the back half of 2015.
Store Rationalization Could Lead to Higher Margins
During the company's latest quarterly earnings call, it was noted that for the first time, the company will be a net closer of stores during the fourth quarter. When questioned about this, management stated that this action was related to the growth in its omni-channel strategy. This makes a lot of sense to us considering that Pier 1's store base (1,072 stores) is much larger than any of its competitors (WSM - 560 total locations including Williams-Sonoma, Pottery Barn and Pottery Barn Kids; Homegoods - ~450 stores; La-Z-Boy - planning to grow to 400 stores over the next several years; Ethan Allen - ~300 stores; Kirkland's - ~330 stores). This can be visualized when looking at Pier 1's store base as compared to WSM. With ~20% of sales (and growing) coming from e-commerce by the end of CY 2015, Pier 1's business model starts to look closer to the likes of WSM (~45% of sales through omni-channel), yet the store base is more "clustered" for Pier 1:


Source: Google Maps (Note: Pier 1 on top and WSM on bottom)
We see above that the PIR and WSM have overlapping store bases by location, but a much larger, clustered store base for PIR. This makes sense considering the large amount of WSM's sales that come from e-commerce. We believe that as omni-channel grows as a percentage of sales, PIR will take a similar route and increase the pace of its rationalization plan. To take this a step further, on several occasions management has noted the flexibility it has in its lease agreements to close locations when it makes sense.
A rationalization strategy makes even more sense when you consider the fact that PIR has remodeled/relocated ~50% of its store base over the past several years, but is now slowing down this program. After seeing productivity improvements through these actions, we believe that the company is positioning its remodeled stores in better locations, and as e-commerce grows, the company can rationalize the older stores and use the remodeled stores as "feeder locations" for displaced sales and "showrooming" of its omni-channel platform. We believe that many retailers will settle on this strategy, but we like the fact that Pier 1 is in a clear position to execute this model. Additionally, the fact that 60% of omni-channel sales touch the physical store base is some way adds to the credibility of the "showrooming" strategy, especially when we consider the Express Request business and its impact on omni-channel.
From a financial perspective, the company will benefit from this strategy in two ways. The main benefit of this strategy change will be found in the company's operating margins, which lag competitors like WSM due to higher occupancy costs.
Occupancy | ||
Gross Operating EBITDA | as a % of | |
PIR | Margin Margin Margin 42.10% 9.90% 12.10% | Sales 16.30% |
WSM | 38.80% 10.40% 14.10% | 12.80% |
Note: HomeGoods has EBITDA margins of 14.5%
As store rationalization occurs, occupancy as a percentage of sales should fall, supporting margin expansion over the next several years (the main bear argument in the market today). Secondly, Pier 1's productivity per square foot ranks last in the furniture industry (~$210 per sq ft. vs. $600 for WSM and $300 at HomeGoods). We attribute this to a variety of factors, but note an unnecessarily large store base that we believe cannibalizes itself as one of the major components. Taking a look at recent quarterly performance, we see in-store comps that declined 7.0% and e- commerce sales comps of +9.5%, showing cannibalization of in-store sales and further proof that a store base of over 1,000 locations is unnecessary and a hindrance to operating performance. Overall, the store rationalization strategy that we believe to be implemented beginning in CY 2015 should be a tailwind to margins for years to come.
Share Repurchases Support Earnings Growth
Over the past few years, the company has been very aggressive in returning cash to shareholders - the company pays, and recently raised, its dividend and has been aggressively repurchasing its stock. Including repurchases made in 2013 and the ~$100MM worth of repurchases made to date in 2014 (average price ~$16), PIR has returned over $500MM to shareholders in the last three years.
Earlier in 2014, Pier 1 made the decision to take on a $200MM term loan, which positioned the company to finish its e-commerce investments and expand its share repurchase activity. This move was not done because of liquidity - the company currently has an undrawn, $350MM revolver, ~$100MM of run-rate cash on the balance sheet, and strong cash flow generation capabilities (operating cash flow of $150MM annually and growing with capex being reduced from $80MM in 2014 to the $60MM range in 2015). Considering the substantial amount of annual free cash flow after dividend payments the company will generate going forward, the company could realistically repurchase 5-10% of the outstanding shares each year for the next several years.
The action to take on the term could also be seen as the early innings of a partial "public buyout" strategy. Considering the company should produce at least $200MM of EBITDA of a go-forward basis (but could produce over $300MM), the company could decide to lever up to the 2.5x Debt/EBITDA range (1.5x using higher-end estimates), providing flexibility to repurchase greater than 10% of the outstanding shares annually on a go forward basis. For our sensitivity analysis, we assume that the company will use excess free cash flow to repurchase 5-20MM shares (90MM currently outstanding) over the next three years now that major capex investments are rolling off.
Comparable Valuation
When looking at Wall Street consensus estimates, we see that sell-side analysts do not believe in the margin potential of the 1 Pier 1 plan:
Operating Margin | CY2014 | CY2015E | CY2016E | CY2017E |
Pier 1 Management | 8.80% | 9.50% | 10.50% | 11-11.5% |
Sell-Side Consensus | 8.80% | 8.60% | 9.00% | 10.00% |
On top of these bearish estimates for margins (driving lower than projected operating results) investors have decided to give Pier 1 an industry-low multiple:
EV/EBITDA | EV/Sales | P/E | |
LZB | 9.6x | 0.9x | 16.7x |
ETH | 8.0x | 1.1x | 15.3x |
WSM | 9.6x | 1.4x | 21.1x |
KIRK | 7.5x | 0.7x | 19.8x |
Average | 8.7x | 1.0x | 18.2x |
PIR | 6.5x | 0.7x | 14.1x |
This double-bearish attitude leads us to a "what can go right" scenario. As we described above, we believe that the company is properly executing on its omni-channel strategy, leading to market share opportunities and margin expansion opportunities through scale, with additional margin upside through store rationalization. Additionally, we believe the industry-low multiple to be unjustified because 1) the entire industry is prone to the current promotional environment 2) we believe that omni-channel retailing is here to stay and this is the right strategy to take on, yet the company is being penalized for these investments and 3) share repurchase activity should support double-digit earnings growth on a go-forward basis.
If the company were to come in line with its margin forecast, we would most likely see both upward estimate revisions and multiple expansion back towards the peer group. As we noted for the reasons in this pitch, we believe that when taking a longer-view, the margin targets are reasonable, and below have provided our "base case" scenario and valuation three years out.
Run-Rate Valuation
For our valuation, we will use the following "Base Case" Valuation:
Base Case - Under our "base case" scenario, the company achieves a 5% compound annual sales growth rate driven by gains in omni-channel (reaching 35% of sales by the end of CY 2017) offset by low-single digit declines in-store. Operating margins improve 150 bps based off slight to no improvement to gross margins (any gains off reduced promotions offset by shipping promotions in e-commerce), leverage in fulfillment once the company reaches >$400MM in e-commerce sales, and slight occupancy leverage due to store rationalization. The company repurchases ~10MM shares over the next three years (80MM shares outstanding at the end of CY 2017).
Using a blended valuation and normalized valuation multiples/DCF discount rates (see appendix) we get a price target of ~$27, representing ~85% upside when accounting for appreciation and dividend payments.
(For more information on Base, Bull, and Bear Case scenarios, including sensitivity analysis, please see appendix)
Risks
(For detailed sensitivity analysis around operating performance, please see the appendix) Risks for the company include:
1.Execution risk of the company's 1 Pier 1 strategy (see 2013 performance). Prolonged miscues could impair operating performance and the value of the company.
2.Increased competition from online retailers as the business model shifts to omni-channel. Amazon.com and other online retailers do offer home products.
3.Along with this risk, gross margin risk is possible as the company may have to provide reduced/free shipping on e-commerce sales. When looking at some online only retailers, we see free shipping offers, which are material in the sales purchase price (though we note that WSM does not offer this service). The company currently runs a "buy online pickup in store" strategy to help offset this risk. Management has noted that all-in, e-commerce margins will be "at least that of in-store."
4.The company may choose to not rationalize its store base, which would impact our longer-term margin projections and investment thesis.
5. The company is heavily dependent on home sales to drive increased demand for goods.
6. The company can be considered a fashion business, and must be able to provide in-demand products for its customers at all times. Additional SKUs will provide more data points for the company to spot changes in trends.
7. 25% of the company's sales come in the months of November and December, making them susceptible to weather issues (this was a major factor of weak performance in 2013).
Conclusion
Pier 1 Imports has undergone a transformation that will set the company up to become a winner in the omni-channel race. Recent hiccups, and short term margin concerns have put downward pressure on both estimates and valuation, sending shares to level in which we find attractive for investment. Strong earnings growth, supported by mid-single digit revenue growth, margin expansion from e-commerce scale, and share repurchase activity, should allow for >20% annual returns over the next three years. Additionally, we believe that PIR is in the early innings of an e- commerce strategy that will eventually lead to store rationalization and improved productivity and margins.
Appendix
Industry Tailwinds Provide Support for Pier 1
Tailwind #1 - A Rebound in Housing Starts - Multiple analyst reports have shown that new home buyers make the majority of their large purchases (i.e. furniture) during the first 18 months after buying a new home. This intuitively makes sense considering people need furniture in their homes once they live there. This fact also makes the furniture industry heavily dependent on new home sales. The US has recently seen a stabilization/pickup in new home sales, which should be a catalyst for the furniture industry for at least the next 18 months, and most likely much longer.
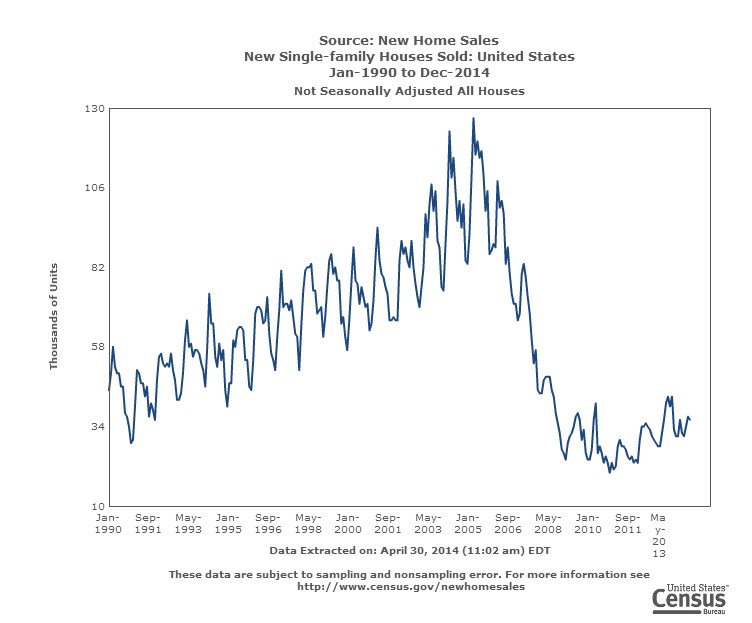
Source: US Census Bureau
Tailwind #2 - Mean-Reversion in Furniture Spending Trends - As the economy improves, discretionary spending, along with furniture spending trends, will improve. It's interesting to look at furniture spending as a percentage of total consumer spending over the last 10 years:
2004 | 2005 | 2006 | 2007 | 2008 | 2009 | 2010 | 2011 | 2012 | 2013 | |
% of total consumer spending on furniture | 1.6% | 1.6% | 1.6% | 1.5% | 1.4% | 1.3% | 1.3% | 1.2% | 1.2% | 1.2% |
Source: Bureau of Economic Analysis
As you can see above, furniture spending as a percentage of consumer spending is currently at a 10-year low. This amount in whole dollar is further depressed by lower total consumer discretionary trends. As the economy begins to improve and housing becoming an increasingly larger driver of economic growth, we believe that furniture spending will see a multi-year run of improved growth. Just as an example, if the furniture industry could get back to just
1.4% of total consumption, assuming no uptick in overall consumer spending trends, that would be a $20B revenue opportunity for the overall industry.
For Pier 1 Imports, this data shows that not only will the company benefit from overall macroeconomic tailwinds for the years to come, but also that the idea of low-to-mid single digit comps is realistic.
Base Case Scenario
Under our "base case" scenario, the company achieves a 5% compound annual growth rate driven by gains in omni - channel (reaching 35% of sales by the end of CY 2017) offset by low-single digit declines in-store. Operating margins improve 150 bps based off slightly no improvement to gross margins (any gains off reduced promotions offset by shipping promotions in e-commerce), leverage in fulfillment once the company reaches >$400MM in e- commerce sales, and slight occupancy leverage due to store rationalization. The company repurchases ~10MM shares over the next three years (80MM shares outstanding at the end of CY 2017).
| Base-Case ($MM) Sales | CY2014 $ 1,896 | CY2015E $ 1,991 | CY2016E $ 2,090 | CY2017E $ 2,195 | |||
COGS | $ (1,119) | $ (1,184) | $ (1,233) | $ (1,295) | |||
Gross Profit | $ 777 | $ 806 | $ 857 | $ 900 | |||
SG&A | $ 569 | $ 577 | $ 585 | $ 601 | |||
EBITDA | $ 209 | $ 229 | $ 272 | $ 298 | |||
EBIT | $ 167 | $ 186 | $ 226 | $ 251 | |||
Net Interest | $ (9) | $ (13) | $ (13) | $ (13) | |||
EBT | $ 159 | $ 173 | $ 214 | $ 238 | |||
Taxes | $ (62) | $ (68) | $ (83) | $ (93) | |||
Net Income | $ 97 | $ 106 | $ 130 | $ 145 | |||
EPS | $ 1.01 | $ 1.21 | $ 1.57 | $ 1.83 | |||
Free Cash Flow | $ 58 | $ 84 | $ 116 | $ 138 |
Bull Case Scenario
Under our "bull case" scenario, the company achieves the mid-to-high single digit sales it expects (7%) driven by better than expected omni-channel growth with minimal sales losses in-store. The company achieves all of its margin improvement initiatives, and benefits an additional 50 bps from store rationalization, reaching 12% EBIT margins by the end of CY 2017. The company deploys all excess free cash flow to dividends and share repurchases, ending CY 2017 with 70MM shares outstanding.
| Bull-Case ($MM) Sales | CY2014 $ 1,896 | CY2015E $ 2,028 | CY2016E $ 2,170 | CY2017E $ 2,322 |
COGS | $ (1,119) | $ (1,197) | $ (1,281) | $ (1,370) |
Gross Profit | $ 777 | $ 832 | $ 890 | $ 952 |
SG&A | $ 569 | $ 592 | $ 619 | $ 627 |
EBITDA | $ 209 | $ 239 | $ 271 | $ 325 |
EBIT | $ 167 | $ 196 | $ 226 | $ 277 |
Net Interest | $ (9) | $ (13) | $ (13) | $ (13) |
EBT | $ 159 | $ 184 | $ 213 | $ 265 |
Taxes | $ (62) | $ (72) | $ (83) | $ (103) |
Net Income | $ 97 | $ 112 | $ 130 | $ 162 |
EPS | $ 1.01 | $ 1.28 | $ 1.60 | $ 2.27 |
Free Cash Flow | $ 58 | $ 90 | $ 116 | $ 154 |
Bear Case Scenario
Under our "bear case" scenario, we assume a low-to-no growth scenario - sales growth CAGR of 1% annually (most of the growth in omni-channel is offset by declines in-store). The company see ~30bps of margin expansion due to a full calendar of lower promotions (most of the reason for the weak sales) and any fulfillment leverage or occupancy cost improvement is offset by higher e-commerce costs (assumption that margins stay near trough historically trough levels removing recession years). Due to lower cash flow generation (still higher than current levels due to lower capital expenditures), the company only repurchases 5MM shares over the next three years (85MM shares outstanding at the end of CY 2017).
| Bear-Case ($MM) Sales | CY2014 $ 1,896 | CY2015E $ 1,915 | CY2016E $ 1,934 | CY2017E $ 1,953 |
COGS | $ (1,119) | $ (1,139) | $ (1,151) | $ (1,160) |
Gross Profit | $ 777 | $ 775 | $ 783 | $ 793 |
SG&A | $ 569 | $ 559 | $ 561 | $ 566 |
EBITDA | $ 209 | $ 216 | $ 222 | $ 227 |
EBIT | $ 167 | $ 173 | $ 177 | $ 179 |
Net Interest | $ (9) | $ (13) | $ (13) | $ (13) |
EBT | $ 159 | $ 161 | $ 164 | $ 166 |
Taxes | $ (62) | $ (63) | $ (64) | $ (65) |
Net Income | $ 97 | $ 98 | $ 100 | $ 101 |
EPS | $ 1.01 | $ 1.09 | $ 1.14 | $ 1.18 |
Free Cash Flow | $ 58 | $ 76 | $ 86 | $ 94 |
| Base-Case ($MM) Sales | CY2014 $ 1,896 | CY2015E $ 1,991 | CY2016E $ 2,090 | CY2017E $ 2,195 | |||
COGS | $ (1,119) | $ (1,184) | $ (1,233) | $ (1,295) | |||
Gross Profit | $ 777 | $ 806 | $ 857 | $ 900 | |||
SG&A | $ 569 | $ 577 | $ 585 | $ 601 | |||
EBITDA | $ 209 | $ 229 | $ 272 | $ 298 | |||
EBIT | $ 167 | $ 186 | $ 226 | $ 251 | |||
Net Interest | $ (9) | $ (13) | $ (13) | $ (13) | |||
EBT | $ 159 | $ 173 | $ 214 | $ 238 | |||
Taxes | $ (62) | $ (68) | $ (83) | $ (93) | |||
Net Income | $ 97 | $ 106 | $ 130 | $ 145 | |||
EPS | $ 1.01 | $ 1.21 | $ 1.57 | $ 1.83 | |||
Free Cash Flow | $ 58 | $ 84 | $ 116 | $ 138 |
Wall Street Consensus
| Sales COGS Gross Profit SG&A | CY2014 $ 1,896 | CY2015E $ 2,000 | CY2016E $ 2,110 | CY2017E $ 2,226 |
$ (1,119) | $ (1,176) | $ (1,239) | $ (1,307) | |
$ 777 | $ 824 | $ 871 | $ 919 | |
$ (569) | $ (598) | $ (625) | $ (637) | |
EBITDA | $ 209 | $ 226 | $ 247 | $ 283 |
EBIT | $ 167 | $ 172 | $ 190 | $ 223 |
Net Interest | $ (9) | $ (13) | $ (13) | $ (13) |
EBT | $ 159 | $ 159 | $ 177 | $ 210 |
Taxes | $ (62) | $ (62) | $ (69) | $ (82) |
Net Income | $ 97 | $ 97 | $ 108 | $ 128 |
EPS | $ 1.06 | $ 1.10 | $ 1.28 | $ 1.56 |
Free Cash Flow | $ 58 | $ 83 | $ 99 | $ 124 |
EBIT Margin | 8.8% | 8.6% | 9.0% | 10.0% |
Sales Growth | 5.5% | 5.5% | 5.5% |