Meet The Contender Dogs
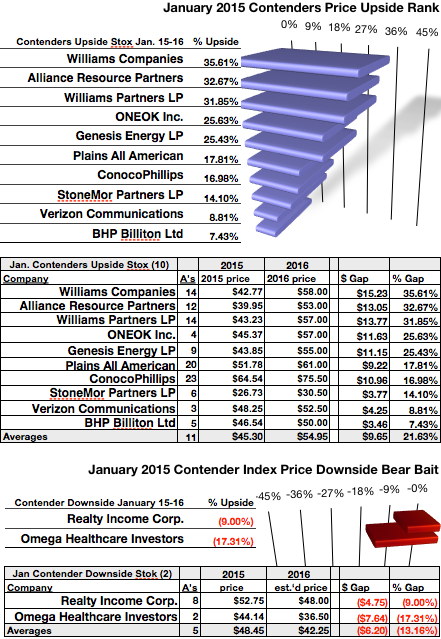
Yield (dividend/price) results from David Fish's Dividend Contenders Index members (as of the January 21 market close) tallied from Yahoo Finance were compared with analyst mean target gain results one year out. The chart below showed eight basic materials, one utility, and one technology stocks posted 7.43% to 35.61% price upsides. However, two financial representatives were expected to lose 9% and 17% for investors in the coming year.
Below, six actionable conclusions were drawn as Arnold top dog January selections by price upside, yield, and net gain were disclosed step by step.
Actionable Conclusion (1) Analysts Expect Ten Contender Dogs To Average 21.63% Upsides; (2) Two To Post 9% and 17% Losses Come January 2016
Forty-five For the Money
This article was written to reveal bargain stocks to buy and hold from January to June or perhaps up to one year. See Dow 30 article for explanation of the term "dogs" for stocks reported based on Michael B. O'Higgins' book, Beating The Dow (HarperCollins, 1991), now named Dogs of the Dow. O'Higgins' system works to find bargains in any collection of dividend paying stocks. Utilizing analyst price upside estimates expanded the stock universe to include popular growth equities, if desired.
Seeking Alpha reader requests prompted this series of index-specific articles reporting dividend yield plus price upside results for these indices: Dow 30; S&P 500; S&P Aristocrats; Russell 1000; Russell 2000; Russell Combined; NASDAQ 100; Champions; Contenders; Challengers; CCC Combined; Global. Bonus reports covered Bad Boy AllStars, and Sector Leaders.
Dog Metrics Measured Contender Stocks by Yield
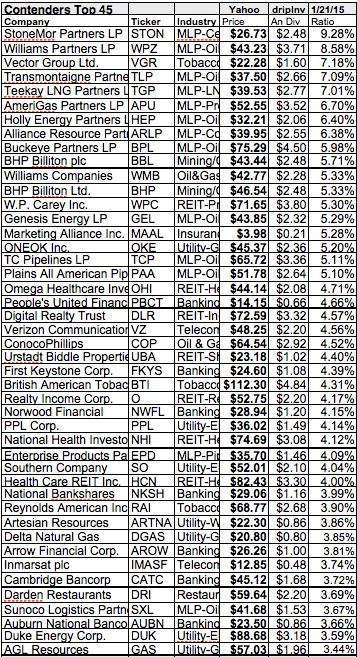
David Fish's December 31 Contenders list (from here) contained stocks distinguished as having paid increasing dividends for 10 to 24 years. Contenders stocks listed below were ranked by yields calculated as of January 21 to reveal the top ten. Price data was sourced from Yahoo. Annual dividend calculations as of 12/31 came from dripinvesting.org.
Four of nine Yahoo Finance market sectors were represented in the top ten contenders dog list selected by yield: services; basic materials; utilities; consumer goods. Top dog, StoneMor Partners LP (STON) [1], was one of two services firms. The other services pup, placed fifth, Teekay LNG Partners LP. (TGP) [5].
In second place was the best of six basic materials firms listed, Williams Partners LP (WPZ) [2] A lone consumer goods stock earned third place, Vector Group Ltd. (VGR) [3]. A lone utility took sixth place, AmeriGas Partners LP (APU) [6]. The balance of the top ten contenders were the other basic materials firms placing fourth, and seventh through tenth: Transmontaigne Partners LP (TLP) [4]; Holly Energy Partners LP (HEP) [7]; Alliance Resource Partners LP (ARLP) [8]; Buckeye Partners LP (BPL) [9]; BHP Billiton plc (BBL) [10]. These completed the top ten contenders dog high yield act for January.
Dividend vs. Price Results Compared to Dow Dogs
Relative strengths of the top ten Dividend Contender dogs by yield as of market close 1/21/2015 compared to those of the Dow were graphed as shown below. Historic projected annual dividend history from $1000 invested in each of the ten highest yielding stocks and the total single share prices of those ten stocks created the data points shown in green for price and blue for dividend.
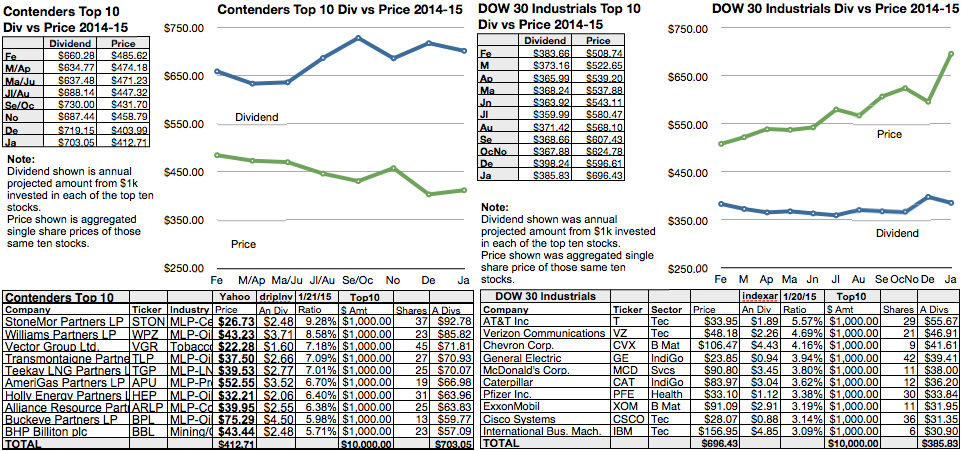
Actionable Conclusion (3): Contenders and Dow Dogs Both Turned Bullish
Contenders top January dividend payers reversed December's retreat on the bear path. In the past month contenders got bullish as top ten dog dividend fell 2% while price rose 2% to sound the bull charge.
Dow dogs got bullish, too dropping 3% in annual dividend from $10k invested as $1K in each of the top ten, while aggregate single share price popped up nearly 17% after December 15.
As a result, the Dow dogs' overbought condition (in which aggregate single share price of the ten exceeded projected annual dividend from $10k invested as $1k each in those ten) widened beyond its record November high. The overhang was $145 or 38% for January; retreated to $125 or 33% in February; swelled to $149 or 40% in March; expanded to $173 or 47% in April; shrank to $170 or 46% come May; swelled to $215 or 59% for July; fell back to $197 or 53% in August; widened to $239 or 65% in September; widened again to $257 or 70% into November; narrowed to $198 or 50% December 15; then gapped wider to $311 or 81% January 20.
To quantify top dog rankings, analyst mean price target estimates provide a "market sentiment" gauge of upside potential. Added to the simple high yield "dog" metric, the analyst mean price target is another tool used to dig out bargains
Actionable Conclusion (4): Wall St. Wizards Wished An 11% Average Net Gain from Top 30 Dividend January Contenders For 2016
Top thirty dogs from David Fish's Dividend Contenders collection were graphed below to show relative strengths by dividend and price as of January 21, 2015 and those projected by analyst mean price target estimates to the same date in 2016.
A hypothetical $1000 investment in each equity was divided by the current share price to find the number of shares purchased. The shares number was then multiplied by projected annual per share dividend amounts to find the dividend return. Thereafter the analyst mean target price was used to gauge the stock price upsides and net gains including dividends less broker fees as of 2016.
Historic prices and actual dividends paid from $1000 invested in each of the thirty highest yielding stocks and the aggregate single share prices of those thirty stocks divided by 3 created data points for 2015. Projections based on estimated increases in dividend amounts from $1000 invested in the thirty highest yielding stocks and aggregate one year analyst target share prices from Yahoo Finance divided by 3 created the 2016 data points green for price and blue for dividend.
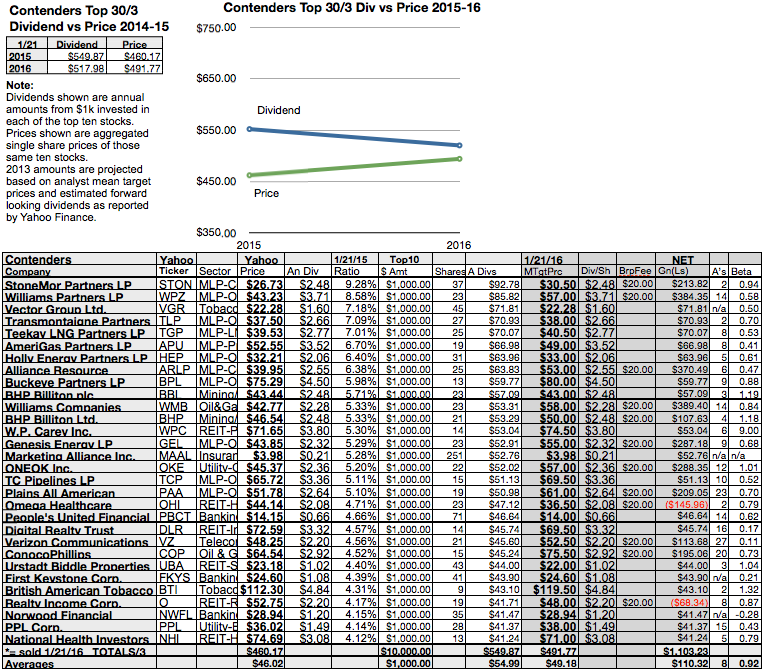
Yahoo projected a 6% lower dividend from $30K invested as $1k in each member of this group while average aggregate single share price was projected to increase 7% in the coming year. The number of analysts contributing to the mean target price estimate for each stock was noted in the next to the last column on the charts. Three to nine analysts have demonstrated the best history for valid estimates.
A beta (risk) ranking for each analyst rated stock was provided in the far right column on the above chart. A beta of 1 meant the stock's price would move with the market. Less than 1 showed lower than market movement. Higher than 1 showed greater than market movement. A negative beta number indicated the degree of a stocks movement opposite of market direction.
Actionable Conclusion (5) : Analysts Assessed 10 Dividend Contender Dogs to Net 10.8% to 38.9% By January 2016
Three of the ten top dividend yielding Contender dogs were verified as being among the ten gainers for the coming year based on analyst 1-year target prices. So this month the dog strategy as graded by Wall St. wizards was 30% accurate.
Probable profit generating trades were revealed by Thomson/First Call in Yahoo Finance into 2015:
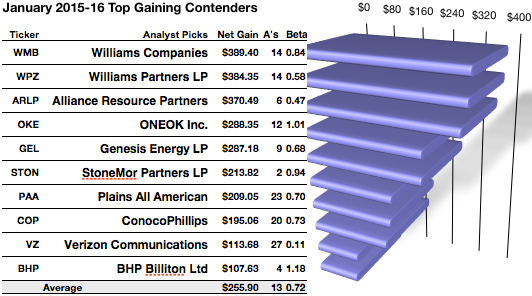
Williams Companies (WMB) was projected to net $389.40 based on dividends plus the median of annual price estimates from fourteen analysts less broker fees. The Beta number showed this estimate subject to volatility 16% less than the market as a whole.
Williams Partners LP was projected to net $384.35 based on a median target price estimate from fourteen analysts combined with projected annual dividend less broker fees. The Beta number showed this estimate subject to volatility 42% less than the market as a whole.
Alliance Resource Partners was projected to net $370.49 based on a median target price estimate from six analysts combined with projected annual dividend less broker fees. The Beta number showed this estimate subject to volatility 53% less than the market as a whole.
ONEOK Inc. (OKE) was projected to net $288.35 based on dividends plus median target price estimate from twelve analysts less broker fees. The Beta number showed this estimate subject to volatility 1% more than the market as a whole.
Genesis Energy LP (GEL) was projected to net $287.18 based on dividends plus median target price estimate from nine analysts less broker fees. The Beta number showed this estimate subject to volatility 32% less than the market as a whole.
Plains All American (PAA) was projected to net $209.05 based on dividends plus the median of annual price estimates from twenty-three analysts less broker fees. The Beta number showed this estimate subject to volatility 30% less than the market as a whole.
ConocoPhillips (COP) was projected to net $195.06 based on dividends plus median target price estimate from twenty analysts less broker fees. The Beta number showed this estimate subject to volatility 27% less than the market as a whole.
Verizon Communications (VZ) was projected to net $113.68 based on dividends plus the median of annual price estimates from twenty-seven analysts less broker fees. The Beta number showed this estimate subject to volatility 89% less than the market as a whole.
BHP Billiton Ltd (BHP) was projected to net $107.63 based on dividends plus median target price estimate from four analysts less broker fees. The Beta number showed this estimate subject to volatility 18% more than the market as a whole.
The average net gain in dividend and price was nearly 25.6% on $10k invested as $1k in each of these ten dogs. This gain estimate was subject to average volatility 28% less than the market as a whole.
Actionable Conclusion (6): (Bear Alert) Analysts Forecast 2 Contender Dogs to Post A Net Losses of 6.83% and 14.6% By 2016
Two probable losing trades revealed by Thomson/First Call in Yahoo Finance into 2015:
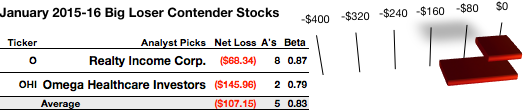
Realty Income Corp. (O) lost $6834 based on dividend and a median target price estimate from eight analysts including $20 in broker fees. The Beta number showed this estimate subject to volatility 13% less than to the market as a whole.
Omega Healthcare Investors (OHI) lost $145.96 based on dividend and a median target price estimate from two analysts including $20 in broker fees. The Beta number showed this estimate subject to volatility 21% less than to the market as a whole.
The average projected net loss in dividend and price was 10.7% on $2k invested as $1k in each of these two dogs. This loss was subject to volatility 17% less than the market as a whole.
The net gain and loss estimates above did not factor in any foreign or domestic tax problems resulting from distributions. Consult your tax advisor regarding the source and consequences of "dividends" from any investment.
Stocks listed above were suggested only as possible starting points for your index dog dividend stock purchase or sale research process. These were not recommendations.
Disclaimer: This article is for informational and educational purposes only and should not be construed to constitute investment advice. Nothing contained herein shall constitute a solicitation, recommendation or endorsement to buy or sell any security. Prices and returns on equities in this article except as noted are listed without consideration of fees, commissions, taxes, penalties, or interest payable due to purchasing, holding, or selling same.
Graphs and charts were compiled by Rydlun & Co., LLC from data derived from www.indexarb.com; http://dripinvesting.org/Tools/Tools.asp; finance.yahoo.com; analyst mean target prices by Thomson/First Call in Yahoo Finance.