By Marjorie Churgin
Schlumberger NV (NYSE:SLB) reports preliminary financial results for the quarter ended December 31, 2014.
This earnings release follows the earnings announcements from the following peers of Schlumberger NV: Halliburton Company (HAL) and Baker Hughes Incorporated (BHI).
Like its peers, Schlumberger NV reported an increase of revenue in Q4 of 2014, up 6.2 percent to a total of $12.64 B, mostly due to its North American operations. However, its net income fell sharply, by 82 percent, to $302 million year-over-year. Despite some improvement at the operating income level in its international operations, the decline was largely from an impairment charge and one-time accounting items related to the fall in the price of oil.
The price of oil, which has declined almost 60 percent since last June, has a huge impact on the operations and results of Schlumberger, the largest oil service provider. Schlumberger, joined its oil service peers in announcing a workforce reduction, planning a layoff of 9,000 workers.
See our analysis of Halliburton Company (Halliburton Earnings: Strong Earnings Despite Oil Weakness) and Baker Hughes Incorporated (Baker Hughes: Beats Estimates Despite Oil Slump).
Highlights
- Summary numbers: Revenues of $12.64 B; Net Earnings of $302 million; and Earnings per Share (EPS) of $0.23.
- Gross margins expanded from 29.4 percent to 31.8 percent compared to the same quarter last year; operating (EBITDA) margins now 28.2 percent from 25.9 percent.
- Ability to declare a higher earnings number? Change in operating cash flow of 1.6 percent compared to same quarter last year better than change in earnings.
- Earnings declined although operating margins improved from 18.1 percent to 19.8 percent.
The table below shows the preliminary results and recent trends for key metrics such as revenues and net income growth:
| 12/31/2013 | 3/30/2014 | 6/29/2014 | 9/29/2014 | 12/31/2014 | |
| Revenues | $11906.00 | $11239.00 | $12054.00 | $12646.00 | $12641.00 |
| Revenue Growth (YOY) | 6.54% | 5.35% | 7.80% | 8.94% | 6.17% |
| Earnings | $1664.00 | $1592.00 | $1800.00 | $1949.00 | $302.00 |
| Earnings Growth (YOY) | 22.08% | 26.45% | -18.88% | 13.64% | -81.85% |
| Net Margin | 13.98% | 14.16% | 14.93% | 15.41% | 2.39% |
| EPS | $1.26 | $1.21 | $1.21 | $1.49 | $0.23 |
| Return on Equity | 17.14% | 15.96% | 17.80% | 19.16% | 3.07% |
| Return on Assets | 10.07% | 9.52% | 10.68% | 11.43% | 1.79% |
Market Share Versus Profits
Sometimes a focus on market share can be accompanied by a reduction in focus on profits or earnings growth.
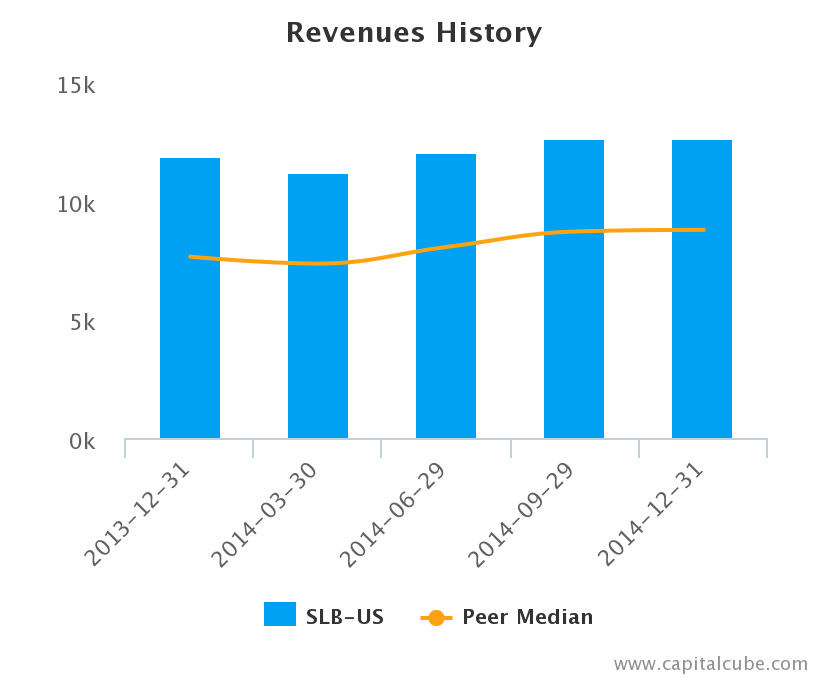
Revenues Trend
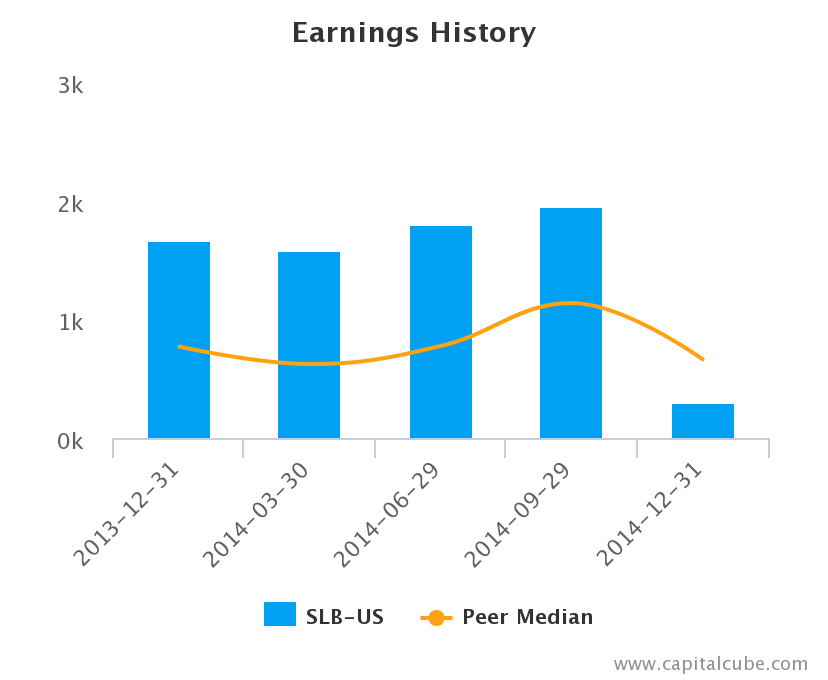
Earnings Trend
Compared to the same period last year, Schlumberger's change in revenue exceeded its change in earnings, which was -81.9 percent. This suggests perhaps that the company's focus is on market share at the expense of profitability. But more important, this revenue performance is among the lowest thus far in its sector - inviting the potential for current and future loss of market share. Also, for comparison purposes, revenues changed by -0.1 percent and earnings by -84.5 percent compared to the quarter ending September 30, 2014.

Revenues vs. Earnings
Earnings Growth Analysis
The company's year-on-year earnings decline did not come as a result of a contraction in gross margins or because of any cost control issues. Both gross margins and operating margins (EBITDA) margins actually improved over this time frame. Gross margins widened from 29.4 percent to 31.8 percent, while operating margins improved from 25.9 percent to 28.2 percent this quarter. For comparison, gross margins were 32.2 percent and EBITDA margins 28.8 percent in Q3 of 2014.
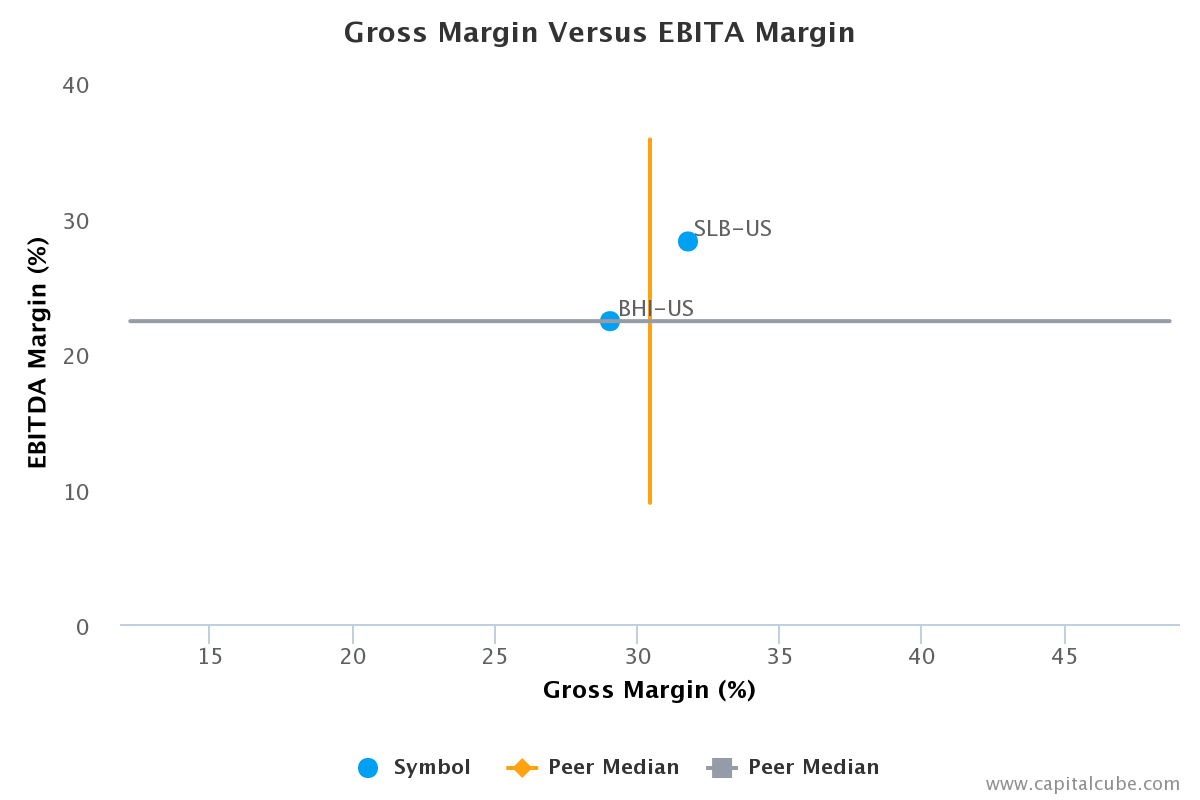
Gross Margin vs. EBITDA Margin
Gross Margin Trend
Companies sometimes extend friendlier terms to customers and vendors, at the expense of improvements in revenues and margins. Capital Cube judges this by comparing the changes in gross margins with any changes in working capital. If the gross margins improved without a worsening of working capital, it is possible that the company's performance is a result of truly delivering in the marketplace and not simply an accounting gimmick using the balance sheet.
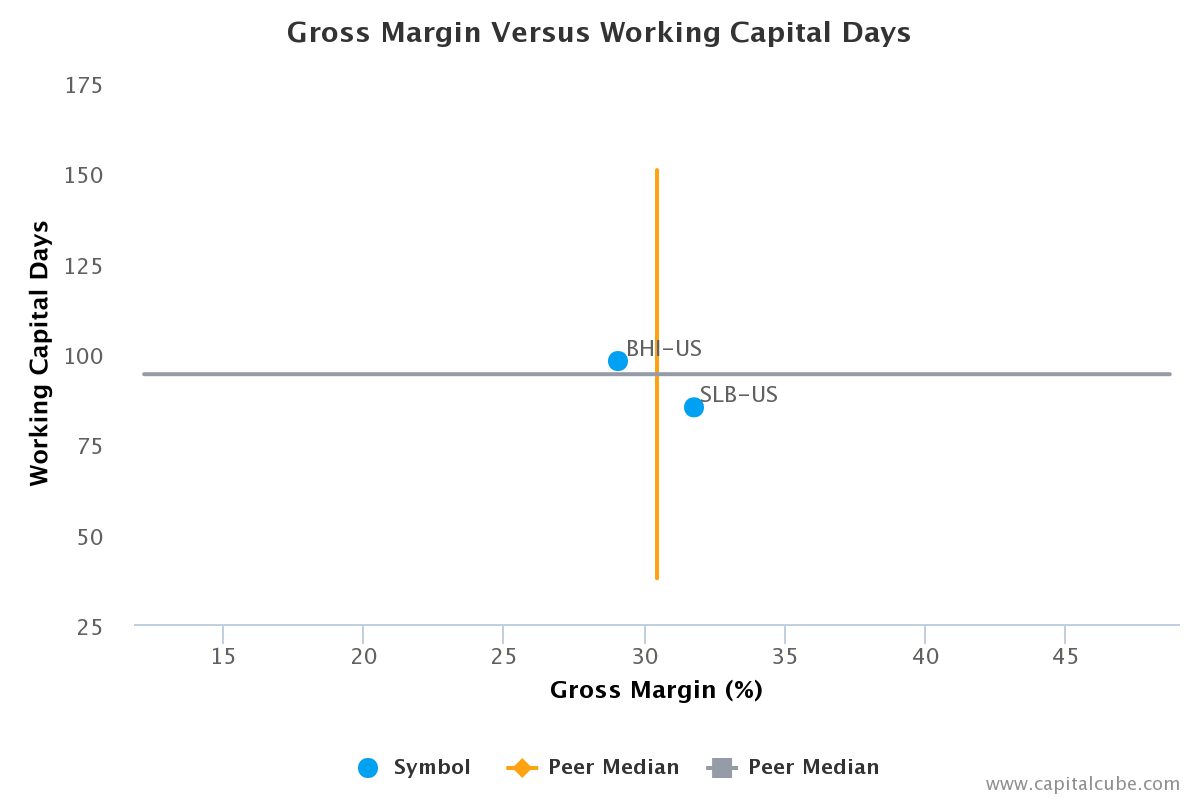
Gross Margin vs. Working Capital Days
Schlumberger's improvement in gross margin has been accompanied by an improvement in its balance sheet as well. This suggests that gross margin improvements are likely from operating decisions and not accounting props. Its working capital days have declined to 85.0 days from 95.7 days for Q4 of 2013.
Cash Versus Earnings - Sustainable Performance?
The company might have been able to declare a higher earnings number, as its year-on-year change in operating cash flow of 1.6 percent is better than its change in earnings. The change in operating cash flow also beat the average of the results announced to date by its peer group.
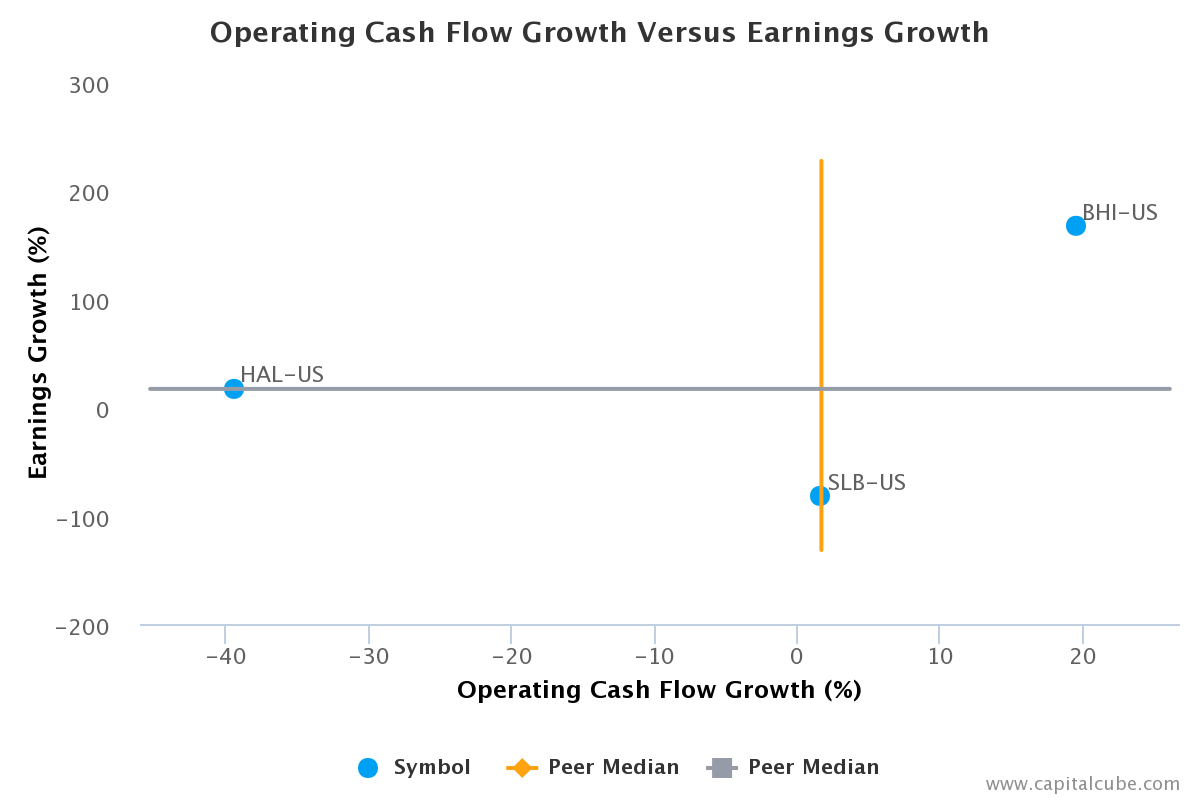
Operating Cash Flow Growth vs. Earnings Growth
Margins
There was an overall improvement in operating (EBIT) margins, from 18.1 percent to 19.8 percent. However, the company's earnings fell. The decline in earnings appears to be largely because of one-time items. Pretax margins declined from 18.2 percent to 5.7 percent.
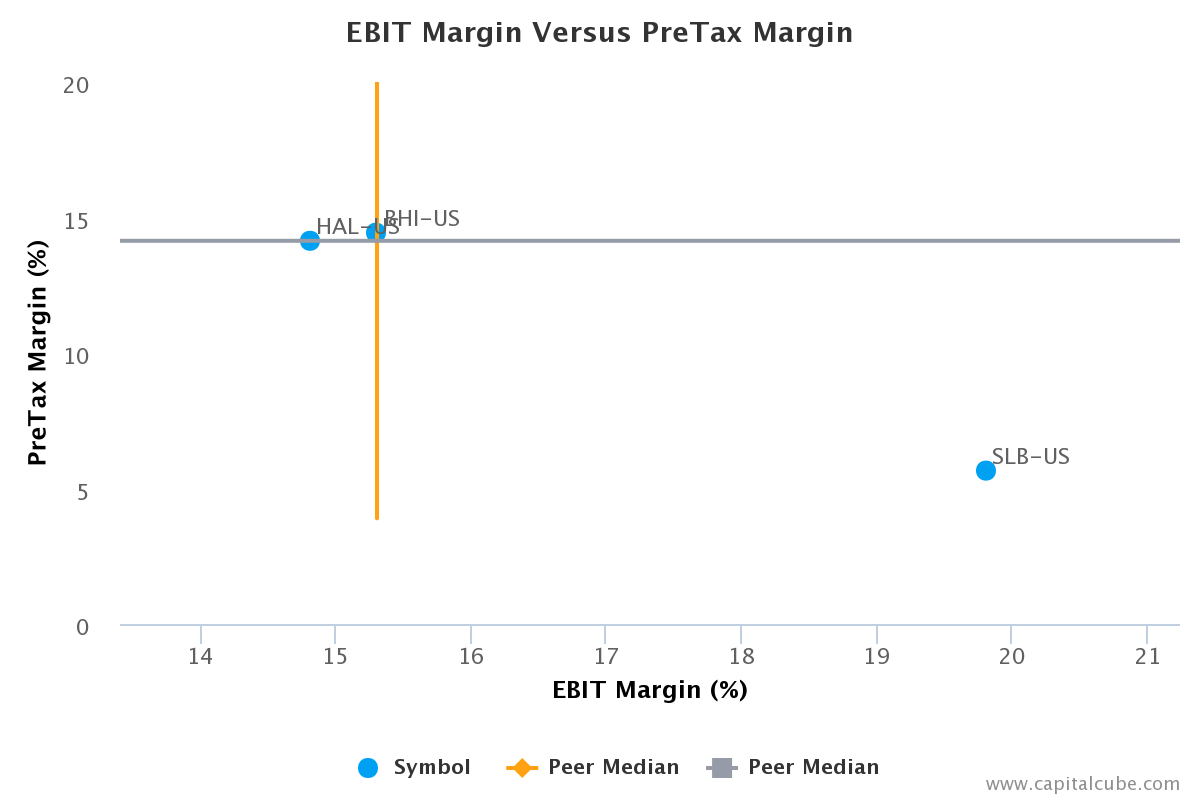
EBIT Margin vs. Pretax Margin
EPS Growth Versus Earnings Growth
The -81.9 percent year-on-year change in earnings is lower than the peer average among the results announced to date, suggesting that the company is losing ground in generating profits from its competitors.

EPS Growth vs. Earnings Growth