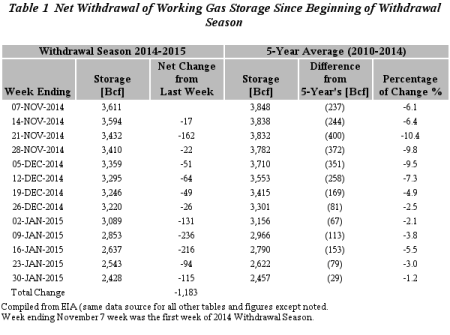
According to the U.S. Energy Information Administration's (EIA) newly released report, working gas (dry natural gas) in storage was 2,428 Bcf (billion cubic feet) as of Friday, Jan. 30, 2015. This represents a net decrease of 115 Bcf from the previous week. Since the beginning of the current withdrawal season (November to March 2015), the total net withdrawal of working gas in storage was 1,183 Bcf, as shown in Table 1.
Since the middle of December, natural gas prices have been depressed due to a relatively milder December and normal January, continuous increases in dry natural gas production, and general weakness in commodities -- particularly crude oil. The depressed natural gas prices have, most of the time, remained below $3/MMBtu since then. With less than two months left in this withdrawal season, the sentiment of NG traders is very bearish.
In order to better understand the current natural gas trading environment, I am going to pay more attention to two main driving forces of NG prices in winter -- namely, dry natural gas production and HDD (heating degree days, using 65 degrees fahrenheit as a base). You can find out more about how the data presented in the tables and figures are prepared in my previous article. I am going to present more tables and figures now, along with further discussion.
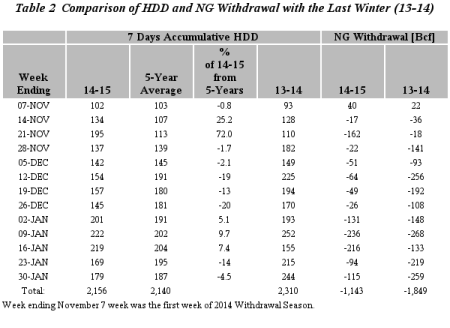
Table 2 tells us that this winter has essentially been normal compared to the last five years' average. And it's just a little less severe than the last season in terms of HDD. That said, weather is not the main cause of low NG prices.
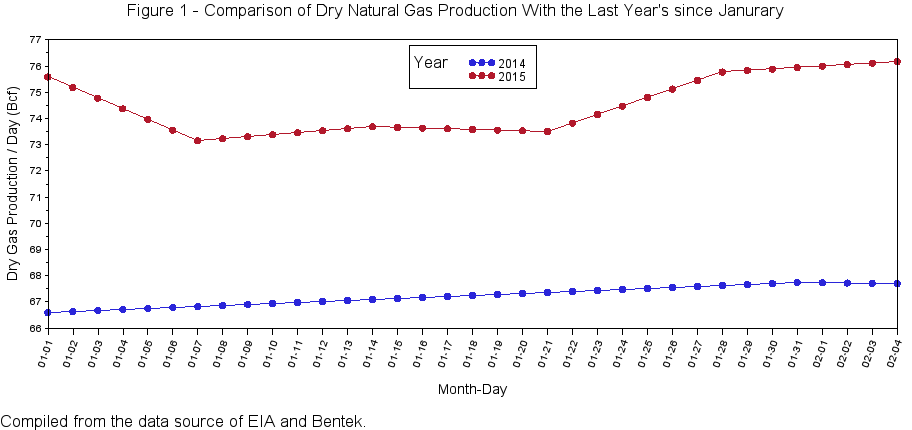
Figure 1 explains without doubt that the current robust dry gas production is the underlying cause of falling NG prices. There are about 30-40 Bcf more per week vs. last year. The next question is: What is going to happen with this level of production? I would like to look at the 2011-12 withdrawal season to make some guesstimates. Table 3 shows NG prices plumped with the widening of the difference between NG storage and that of the five years' average in the 2011-12 withdrawal season. We can see that the percentage difference stubbornly increased from 6% to 60% more than the five years' average, resulting in the price crashing to $2/MMBtu in the end.
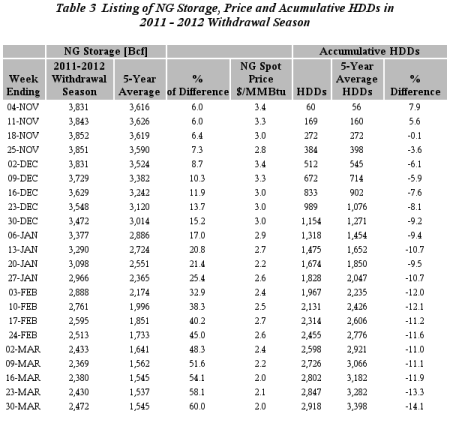
Sentiment is even worse currently. The following is a snapshot of NG cash prices I took from the Wall Street Journal. As of when this article was prepared, the NG spot is trading around $2.7/MMBtu. In Table 3, this price went along with NG storage about 40% more than the five years' average. But the current NG stock is less the five years' average, although by just a trivial amount. It seems people are taking the high dry gas production ( 73-75 Bcf/day) for granted in the coming months.
NG Cash Price at different Hubs | Wed (2-4-2015) | Day Before | Year Ago |
Natural Gas, Henry Hub-I | 2.73 | 2.67 | 7.9 |
Natural Gas, Transco Zone 3, $ per Mmbtu-I | 2.73 | 2.66 | 7.94 |
Natural Gas, Transco Zone 6 NY, $ per MMBtu-I | 13.23 | 3.74 | 20.77 |
Natural Gas, Panhandle East, $ per MMBtu-I | 2.41 | 2.39 | 37 |
Natural Gas, Opal, $ per MMBtu-I | 2.36 | 2.31 | 30.18 |
Natural Gas, Marcellus NE PA, $ per MMBtu-I | 1.41 | 1.3 | 3.51 |
Natural Gas, Haynesville N. LA, $ per MMBtu-I | 2.66 | 2.61 | 7.89 |
I prepared Figure 2 to depict what could happen in the coming months before November 2015, namely before the beginning of the next withdrawal season, by adding 25 Bcf/day to the five years' average of withdrawal and injection during this period.
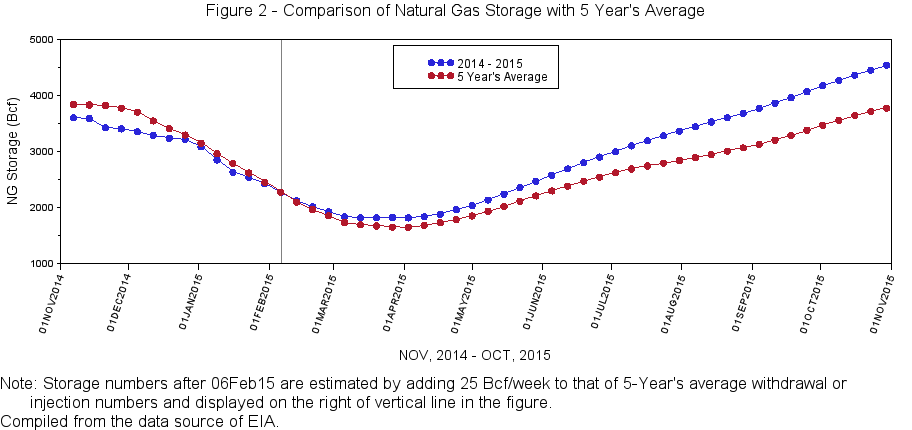
This could be one of the worst-case scenarios. As we know, the national working gas designed capacity as of November 2013 is only 4,681 Bcf. Figure 2 suggests an alarming number of 4,450 Bcf at the end of October 2015. But I really doubt this could happen as more power burn, industry use, planned LNG exports, more exports to Mexico, etc. -- just name a few possibilities -- could absorb this "glut." NG producers are decreasing new well drilling and could shut in the legacy wells if they're not cash constrained. Also, byproduct gas from oil wells could be reduced rapidly as tight oil drilling activity is cooling. The shale gas industry by itself requires constant new production capacity input to just maintain legacy production. Take Marcellus field as an example, which accounts for about 22% of the nation's total dry gas production (16.5 Bcf/day vs. 75 Bcf/day).
Table 4 -- Recently Dry Gas Production (Mcf/Day) and Legacy Decline Rate in Marcellus Shale Field
Month | Legacy Production Decline | Total Production | Decline Rate (%/month) |
Oct-14 | (556,250) | 14,997,047 | |
Nov-14 | (569,783) | 15,610,682 | -3.8 |
Dec-14 | (582,926) | 16,105,113 | -3.7 |
Jan-15 | (596,553) | 16,318,725 | -3.7 |
Feb-15 | (610,223) | 16,549,316 | -3.7 |
Note: Monthly decline rate is calculated by dividing the Last Total Production with the current month's Legacy Production Decline.
From Table 4 we can see that the Marcellus shale gas field has a large decline rate because most of its wells were drilled within the last three years. Currently, there are about 105 rigs in the Marcellus shale field that contribute about 840,000 Mcf/day by EIA's estimates. This amount well offsets the legacy decline; thus, total production keeps rising in that field. But keep in mind that the Marcellus field is the best player in the shale gas boom in terms of absolute amount and economics. We only can hope Marcellus is slowing momentum and other fields could do more to bring the market into balance. Unfortunately, the gas rig count did not decrease dramatically as the oil rig count in the week ending Jan. 30, 2015.
Rig Count (EIA) | |||
Change from | |||
Friday, Jan. 30, 2015 | last week | last year | |
Oil rigs | 1,223 | -7.14% | -13.99% |
Natural gas rigs | 319 | 0.95% | -10.89% |
Miscellaneous | 1 | 0.00% | -80.00% |
Lastly, I present the current EIA's Natural Gas Weekly Update Supply and Demand tables here, and encourage readers check this page every week and read all the contents there.
| U.S. natural gas supply - Gas Week: (1/28/15 - 2/4/15) | ||
|---|---|---|
| Percent change for week compared with: | ||
| last year | last week | |
| Gross production | 12.61% | 0.46% |
| Dry production | 12.49% | 0.46% |
| Canadian imports | 1.69% | 2.87% |
| West (net) | -4.64% | -9.17% |
| Midwest (net) | -8.63% | 16.61% |
| Northeast (net) | 32.63% | 16.71% |
| LNG imports | 130.58% | 56.93% |
| Total supply | 11.99% | 0.91% |
| U.S. consumption - Gas Week: (1/28/15 - 2/4/15) | ||
|---|---|---|
| Percent change for week compared with: | ||
| last year | last week | |
| U.S. consumption | -1.3% | 7.8% |
| Power | 10.8% | 2.8% |
| Industrial | -0.0% | 0.7% |
| Residential/commercial | -6.5% | 13.8% |
| Total demand | -1.0% | 7.4% |
I think we have a ways to go before we see sustainable $3.5/MMBtu in the coming months. I hope the market could hold $2.5/MMBtu for the rest of the winter. I suggest NG gas bulls sit on the sidelines, watching as the market evolves. In conclusion, we are in a bear trend in trading natural gas backed financial products, such as United States Natural Gas ETF (UNG), VelocityShares 3x Long Natural Gas ETN (UGAZ), and other natural gas ETFs. I think we have not seen the bottom yet, though swing trading could make you a small profit if you bet right in the meantime.
Nymex: March 2015 NG Future Contract Price Chart as of Feb. 6, 2015 (12:01 p.m. ET)
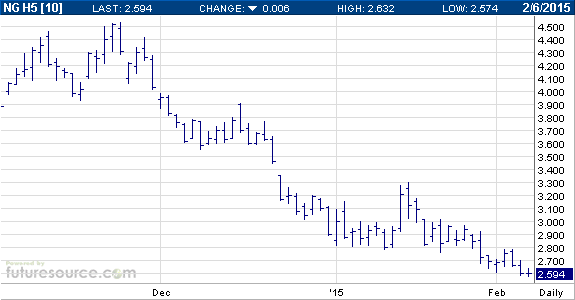
The market is as hard to predict as weather. If a severe polar vortex is coming, the chart will likely break out shortly. On the other hand, if the rest of the winter is above normal, it could go down further. To logically trade natural gas, closely watch three numbers: NG storage, dry gas production, and Nymex spot and future prices. In the winter, HDD also counts. I am keeping a close watch on the development of the driving forces of NG prices, and will share my research with Seeking Alpha readers accordingly.