Leaders from the G20 economies, or the 20 largest economies in the world, are meeting in Istanbul this week, and are discussing a range of topics from Greece, to economic conditions. In an effort to better examine the state of the global economy, an aggregation of economic indicators, tailored specifically to G20 countries, will give a look at what has been done since the financial crisis, and what still needs to be reformed.
Below is a chart of the annual change in consumer prices throughout the G20. Since the financial crisis, the annual pace of inflation slowed from over 5% in 2009, to now contraction. Over the last few years, a deflation spiral has taken control of most world economies, most notably in the euro area and the U.K., where monetary stimulus remains a key part of policy. Declining energy prices weighed on inflation measures in the second half of 2014, and should continue to weigh on measures in 2015. Moreover, growth in real wages remains tepid.

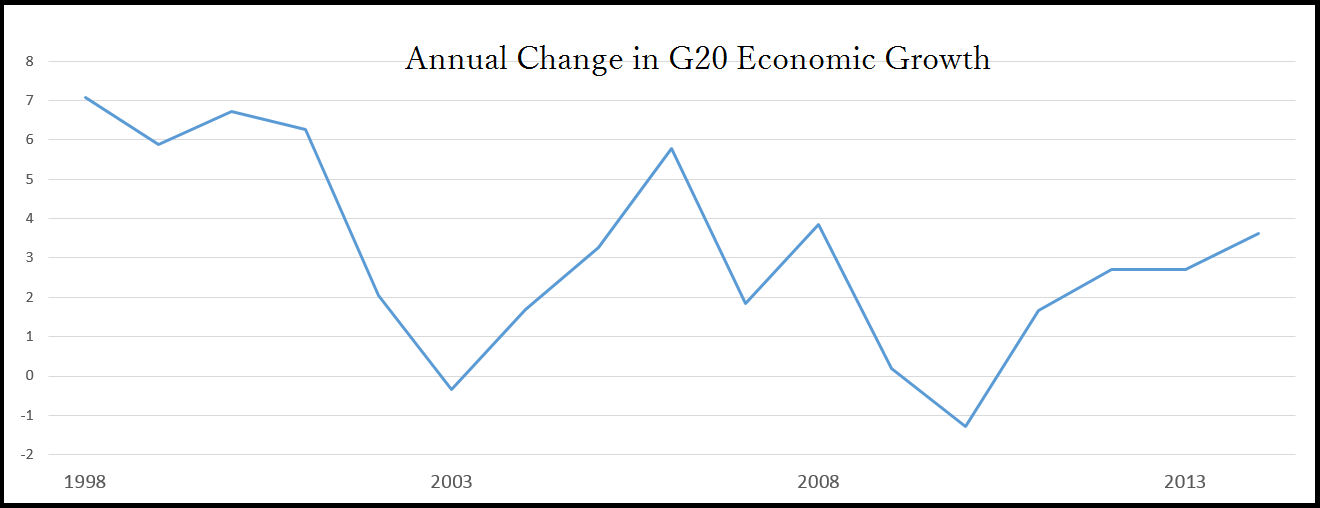
Data provided by the OECD
Meanwhile, real economic growth measures rebounded over the last few years. After bottoming at -1.27% annual growth in 2010, G20 economic growth rose to 2014 levels of an aggregate 3.61%. While current growth remains below the near 6% annual pace seen in 2006, a recovery is still under way. Massive monetary stimulus programs led to low interest rates, while falling prices benefited consumer incomes, both contributing to growth increases in the G20.
Data provided by the OECD
Lastly, since the financial crisis, many G20 countries resorted to running government deficits to fuel recoveries, pushing the overall level of deficit deeper as a percent of economic growth. The chart below represents the median government budget of G20 countries. Following the recession in the early 2000's, deficit spending went from a strong trend lower, to nearly reaching break even in 2007. Suddenly, the financial crisis hit, pushing the deficit spending to decade lows of nearly -5% of GDP. With economic growth slow to recover, the median budget deficit remained near 5% over the last few years. This made it a difficult task to reduce debt to economic growth ratios.
After examining G20 economies, a few trends are apparent. Inflation measures across the globe continue to decline on weak wage growth, as well as falling energy prices. Labor markets across the globe improved, but laborers do not hold power at current times. Therefore, economic profits are, for the most part, fueling stock market gains, while benefiting the average citizen very little.
Moreover, economic growth increased the last few years, but much of the recovery has been fueled by deficit spending, meaning that debt to economic growth levels have yet to recede. Many central banks are committed to cutting interest rates and increasing stimulus spending, which means currencies in economies that are tightening policy, such as the U.S., should continue to outperform.

Data provided by the OECD