Moody's cross-over Ba1 credit rating for General Motors Company (NYSE:GM) materially overstates the company's fundamental credit risk. GM's fundamentals show strong cash flows that exceed all operating obligations by 20%-30% each year, indicating that the company has no concern over any need to refinance its debt due to their sufficient liquidity. The company also has significant capital resources such as a $2.5bn undrawn revolver, over $26bn cash on hand and a substantial recovery rate at 175%, signifying that the risk of default is unlikely. These factors drive a Valens credit rating of IG3+ (equivalent to A1), an upper-medium investment grade rating six notches above Moody's rating. (To register for free access to our corporate credit ratings, please click here.)
As with the ratings agencies, credit markets are overstating GM's credit risk. Credit default swap (CDS) pricing is overstating credit risk at 163bps while 2018 cash bond YTW is also overstating credit risk at 2.705% or 154bps Spread-to-Worst. In comparison, Valens' Intrinsic CDS (iCDS) is much safer at 62bps and Intrinsic YTW (iYTW) is a much safer 1.785%. Spreads are thus expected to tighten as credit markets better understand GM's true credit profile.
Cash Flow Profile
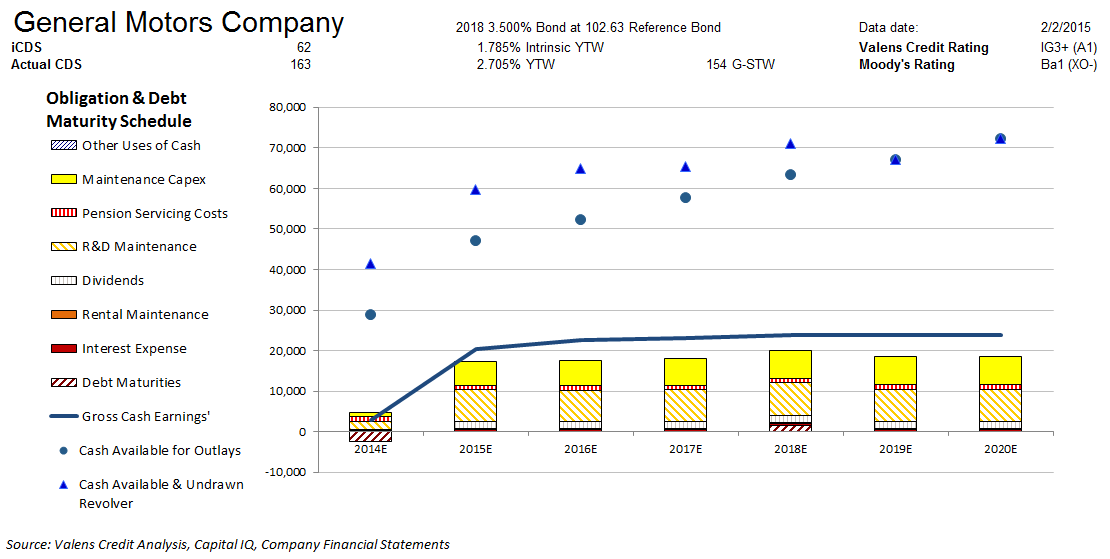
Valens Credit produces a Credit Cash Flow Prime chart for General Motors Company, as it does for every company it evaluates. The chart provides a far more comprehensive view of credit fundamentals than traditional ratio-based analyses. It shows the cash flow generation and cash obligations related to the credit of the firm, adjusted for non-cash financial statement reporting distortions from GAAP. The blue line indicates the gross cash earnings (Valens' scrubbed cash flow number) expected to be generated based on consensus analyst estimates and Valens Credit's in-house research team. The blue dots above that line include the cash available when cash on the books and existing, available credit lines are used.
The colored, stacked bars show the cash obligations of the firm in each year forecast. The most difficult obligations to avoid are at the bottom of each stack, such as interest expense. The obligations with more flexibility to defer year-to-year, such as pension contributions and maintenance capital expenditures, are at the top of the stacked bars. All of the calculations are adjusted for non-cash distortions that are inherent in GAAP accounting, including the highly problematic and often misused statement of cash flows.
If the company generates and has cash levels that are above their obligations, the risk of default is extremely low, as is the case with GM. Even if the cash generated yearly is close to the levels of the stacked bars, a company generally has the flexibility to defer payments of various kinds. For example, they can allow assets to age a little longer, or they can cut certain maintenance costs such as maintenance capex. While decisions such as those can create other business concerns, the issue in credit risk is "Can the company pay their credit obligations?".
As shown in the chart above, GM's operating cash flows alone can easily exceed all operating obligations including its debt maturities by approximately 20%-30% a year except in 2018, with only about a 16% buffer given a $1.5bn debt maturity in that year. It is noteworthy that GM has managed to sustain strong operating cash flows despite the macroeconomic challenges in almost all of its operating markets (Europe, Latin America, and some Asia-Pacific markets), and the expense pressures from the restructuring and the recall-related expenses.
The company's current cash on hand of $26bn is also expected to grow in the next six years, further justifying that GM's credit profile carries practically no risk. Additionally, GM can easily access the credit markets in case they need additional funds, since their recovery rate is robust at 175% and given their roughly $56bn market capitalization.
Management Incentives
Senior executives and board members - like most people - do what they are paid to do. This is why GM's Form DEF 14A is key to understanding this company's fundamentals, something that credit rating agencies seem to be completely missing. Valens' Incentives Dictate Behavior™ analysis focuses on GM's senior executive compensation and governance. This analysis is meant to help investors understand corporate governance, how aligned a management team may be with shareholder interests, and the potential consequences of a management compensation framework to the business.
GM's management compensation highlights positive signals for credit holders. The firm uses metrics such as adjusted EBIT, adjusted automotive FCF, quality of earnings, and ROIC. EBIT compensation drives management to improve margins and grow revenue, while automotive FCF compensation should drive management to maximize margins, improve working capital management, and limit capex. In addition, the focus on automotive FCF should drive management to focus more on improving their core operations as opposed to just their financial subsidiary. The quality of earnings metric would also ensure that management is focused on improving profitability in sustainable ways. Lastly, ROIC compensation should drive management to focus on improving both margins and asset utilization. The combination of these metrics should lead to a better ROA' (Valens' Adjusted Return on Assets) and therefore, more cash for obligations going forward.
Management Representations
Valens provides analyses of companies' statements on earnings calls, termed Management Representation Benchmarking™. This analysis is meant to help assess a management team's confidence during conference calls when discussing certain areas of the business such as operations, stability, strategies, ability to manage business risks, and especially their liquidity and solvency.
The analysis of GM's Q3 2014 earnings call highlighted mixed signals. Management was confident about their core operating performance in GM North America, and when talking about the huge upside potential in their brands and with the GM Financial business. They were likewise confident when saying that they have the right talent, technology, and means to deliver products and experiences that people love.
However, management may have been exaggerating the growth in their market share of SUV retail in North America, as well as the strength of their next-gen products such as Cruze, Malibu, and Equinox. They may likewise be concerned about the sustainability of their overall financial performance amid impacts from the continued sluggishness around Europe and the FX pressures in Latin America. Most importantly, management may be concerned about their ability to hit their full-year target growth and the sustainability of their short-term liquidity due to the anticipated continued spending for pension and other post-employment benefits (OPEB) contributions, restructuring expenses associated with their Australian and European manufacturing, as well as some recall-related cash payments.
Even if these issues were to bear fruit and thus negatively impact cash flows, GM's cash profile remains resilient, with cash on hand still significantly exceeding all obligations in the next few years even in the unlikely case that their cash flow does not. In addition, the firm has been able to manage a healthy cash flow despite recent macro-economic challenges in almost all of GM's operating markets. The company has no concerns as regards its debt maturity headwalls, dividends, and business restructuring costs. (More about Valens' innovative research tools is available here.)
Conclusion
A company's credit risk is ultimately driven by cash available against cash obligations. Given their level of cash generation from operations, their current cash on hand, and their expected cash build, GM's fundamental credit risk is being materially overstated by ratings agencies and overstated by CDS markets. GM's ratings should improve and credit market spreads should tighten, once the credit markets and ratings agencies see the company's performance and better understand their true credit profile.
If you would like to purchase Valens' most recent full credit report on GM, please click here.
Valens Credit Ratings are those made by the Valens Credit organization, determined by a ratings committee in a systematic process, and not the opinion of any single person.
Our Chief Investment Strategist, Joel Litman, chairs the Valens Credit ratings committee. Litman served as final editor of this Seeking Alpha article and the related reports supporting the findings published herein. A biography of Joel Litman can be found at joellitman.com.