Calumet Specialty Products Partners LP (NASDAQ:CLMT) has routinely made many of my lists of basic materials and energy dividend stocks. CLMT is a small refining company that produces and sells hydrocarbons, including lubricating oils, solvents, waxes, fuel, and white mineral oils, throughout North America. CLMT refineries and facilities are primarily located in Louisiana, but CLMT also has assets in Texas and Pennsylvania and a terminal located in Burnham, Illinois.
Calumet Specialty Products Partners, L.P. (the “Company”) is a Delaware limited partnership. The general partner of the Company is Calumet GP, LLC, a Delaware limited liability company. As of June 30, 2011, the Company had 39,779,778 common units and 811,832 general partner units outstanding. The number of common units outstanding includes 13,066,000 common units that converted from subordinated units on February 16, 2011. There are no longer any subordinated units outstanding. ... The general partner owns 2% of the Company while the remaining 98% is owned by limited partners. - CLMT SEC June 30, 3011 10-Q.
CLMT had about $2.2 billion in revenue in 2010, but just $17 million in net income. CLMT has a market capitalization of $671 million and an enterprise value of $1.1 billion, suggesting some leverage. CLMT operates in two segments: specialty products and fuel products; however, in 2010, specialty products contribution 94.3% of gross profits, despite being only around 50% of revenue. Fuel products sold include gasoline, diesel, and jet fuel.
Partnership status creates additional considerations
CLMT is also a partnership which will create additional tax and valuation implications. It is difficult to compare partnerships to dividend paying corporations. A distribution yield should not be equated to a dividend yield. Distributions are cash payments that are made to partnership unit owners. The company's actually net income benefits and liabilities are then also separately allocated to partnership unit owners, with the owners being responsible for the taxes. Distributions can also result in a reduction in the cost basis of the investor's position, creating a future capital gains liability. This is similar to when a corporation makes a "dividend" payment in excess of available retained earnings. The excess is treated as a return of capital and effectively lowers the investor's cost basis.
CLMT has an attractive yield
During its public life, CLMT has a strong track record of paying distributions, albeit with varying growth. CLMT's estimated forward yield is 11.8% based upon a closing price of $16.86 and my projected annual distribution of $2.00. The following table shows the estimated forward quarterly distributions as well as the recent historical quarterly distributions.
Historical and Projected Distributions
| Type | Ex-Date | Quarterly Distribution ($ per share) | Change on prior year |
| Projected | 7/29/2012 | 0.510 | 3.0% |
| Projected | 4/29/2012 | 0.495 | 4.2% |
| Projected | 2/2/2012 | 0.495 | 5.3% |
| Projected | 10/29/2011 | 0.495 | 7.6% |
| Historical | 7/29/2011 | 0.495 | 8.8% |
| Historical | 4/29/2011 | 0.475 | 4.4% |
| Historical | 2/2/2011 | 0.470 | 3.3% |
| Historical | 10/29/2010 | 0.460 | 2.2% |
| Historical | 7/30/2010 | 0.455 | 1.1% |
| Historical | 4/30/2010 | 0.455 | 1.1% |
| Historical | 1/29/2010 | 0.455 | 1.1% |
| Historical | 10/30/2009 | 0.450 | 0.0% |
| Historical | 7/31/2009 | 0.450 | 0.0% |
| Historical | 5/1/2009 | 0.450 | 0.0% |
| Historical | 1/30/2009 | 0.450 | -28.6% |
| Historical | 10/31/2008 | 0.450 | -28.6% |
| Historical | 7/31/2008 | 0.450 | -28.6% |
| Historical | 5/1/2008 | 0.450 | -25.0% |
| Historical | 1/31/2008 | 0.630 | 5.0% |
Source: Author estimates, Yahoo!Finance
The following graph shows the historical trailing twelve month yield and spread to the 10-year Treasury bond.
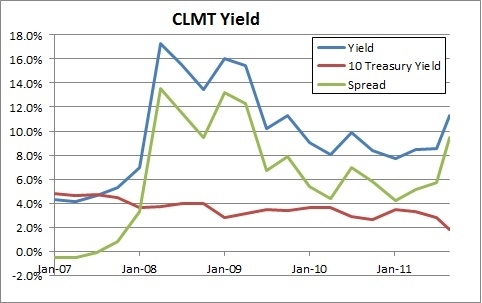
Created from data from Yahoo!Finance
The next graph shows the normalized performance of the stock price, the dividend, and the trailing dividend yield.
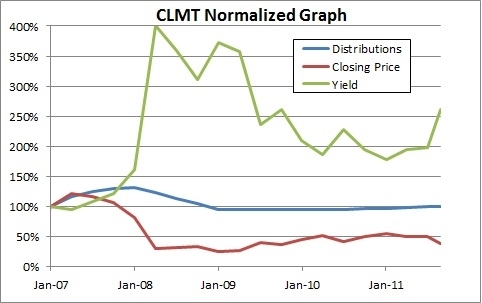
Created from data from Yahoo!Finance
The above chart shows that CLMT has paid relatively consistent annual distributions, but with a unit price that dropped substantially in 2008 and has yet to recover. This resulted in a very high yield.
CLMT may be undervalued ...
The first step to using the dividend discount model is to calculate an equity hurdle rate with the Capital Asset Pricing Model. CLMT has a beta of .23 and with the risk free rate at a very low 1.8% this gives the discount rate to be a 3.4%, which is so low as to raise questions about methodology.
As noted above the forward distribution is approximately $2.00. Applying a long term growth rate of 0% gives an estimated price of $58.37 for CLMT, which is a substantial premium to the recent closing price of $16.86.
When discrepancies this large appear, it is critically important to dig deeper into the stock and the analysis. The first key sensitivity is around discount rate which was 3.4%. Setting the discount rate at 6% would reduce the $58.37 to $33.25 per unit. Another part of the difference is driven from partnership economics which make the dividend discount model not entirely applicable. It is quite possible for a cash distribution to be low while the company's net income is high, resulting in a substantial tax liability for the investor. Furthermore, if it is necessary to raise debt to make distributions then this is a capital transfer and not a return on investment like a dividend. It these adjustments reduce the distribution by 50% this would further reduce the implied value to just $16.63 per unit which is in line with the market price.
CLMT faces several risks
However, CLMT's valuation is predicated upon sustainable distributions. Quite possibly there is a substantial risk that they are not sustainable, especially given a low recent net income this could be true.
Furthermore, CLMT has raised additional funds to manage operations through the first half of 2011. CLMT raised $400 million in senior notes to fund operations. A portion of these proceeds were used to retire existing debt. Cash flow from operations for the first half of 2011 was a negative $70.6 million. However, this was a largely driven by a $111.6 million increase in inventories. In the future, when the inventories are sold or processed into products and sold, that cash outlay would reverse itself. Looking forward, analysts expect earnings per unit of $0.73 for 2011.
CLMT is also exposed to general economic conditions and demand for its products, most importantly specialty chemicals which drive its overall profitability.
Disclosure: I have no positions in any stocks mentioned, and no plans to initiate any positions within the next 72 hours.
Disclaimer: This article is for informational and educational purposes only and shall not be construed to constitute investment advice. Nothing contained herein shall constitute a solicitation, recommendation or endorsement to buy or sell any security. This article reflects the author's general understanding of partnership economics and tax implications and was written as a learning exercise.