Danaos Corporation (NYSE:DAC) has a fleet of 56 containerships, aggregating 334,239 TEUs deployed under multi-year fixed rate time charters that range from less than one to 18 years. As of February 27, 2015, the average age (weighted by TEU) was 6.6 years, with the average remaining duration of the charters for the fleet being 7.8 years.
Before jumping into the numbers, it is important to realize that rates in the shipping industry are heavily influenced by the macro environment. For those interested in my take on the containership market at large, here is my Container Shipping Market Macro Update.
Q1 2015
On April 27th, Danaos reported Q1 2015 results that came in above the consensus on both revenue and EPS. Danaos beat the consensus estimate of $0.21 by $0.07 posting $0.28 EPS. Revenue came in at $138.61 million compared to the consensus estimate of $136.60 million.
Adjusted net income of $30.6 million or $0.28 per share for Q1 represents a 337% increase over the previous year. Speaking on the massive increase in EPS, Dr. John Coustas, Chief Executive Officer, stated in the earnings call that "the company's profitability improved between the two quarters through $10 million improvement in net financing costs, together with $4.5 million improvement in operating costs and a $3.1 million increase in operating revenues." He continued, "the trend of reduced financing costs and as a consequence increased earnings will continue through 2015, as we continue to reduce debt and benefit from the expiration of expensive interest rate swaps."
Adjusted EBITDA for Q1 2015 increased by 6.5%, or $6.3 million to $102.7 million over Q1 2014. The gain is attributed to the increase in operating revenues and the decrease in total operating expenses between the two periods.
As noted in the Q1 earnings release, vessel operating expenses decreased 9.6%, or $2.9 million, to $27.3 million in Q1 2015, from $30.2 million in Q1 2014. The reduction is attributable to an 8.0% improvement YoY in the average daily operating cost per vessel, moving to $5,622 per day from $6,110 per day. The sale of older vessels in the fleet, whose contribution in daily operating expenses was higher than the fleet average, composed 3% of that 8% reduction. The average daily operating cost per vessel also decreased as a result of a 17.6% improvement in the average Euro to Dollar exchange rate between the two periods which composed the remaining 5% of that 8% reduction.
Interest expense decreased by 13.3%, or $2.8 million, to $18.2 million in Q1 2015, from $21.0 million in Q1 2014. Debt reduction will play an increasing role in Danaos' profitability going forward according to Evangelos Chatzis, Chief Financial Officer, who stated that "our financing costs will continue to improve in the coming quarters as we continue to de-lever our balance sheet and expensive interest rate swaps continue to expire. To put this into perspective, our adjusted net income currently at $30.6 million would have been $50.9 million or $0.46 per share instead of $0.28 if the current interest rate swaps were not in place."
Mr Chatzis continued, "these swaps have already started to expire and will continue to expire through the remainder of the year. As a result, we expect the consistent improvement in financing costs over the next quarters, given the market expectations for low interest rates to persist. We believe that we will be able to take advantage of the anticipated low LIBOR environment on the back of solid contracted income generation."
What to watch going forward
Below are two potential cases for net finance costs regarding their debt.
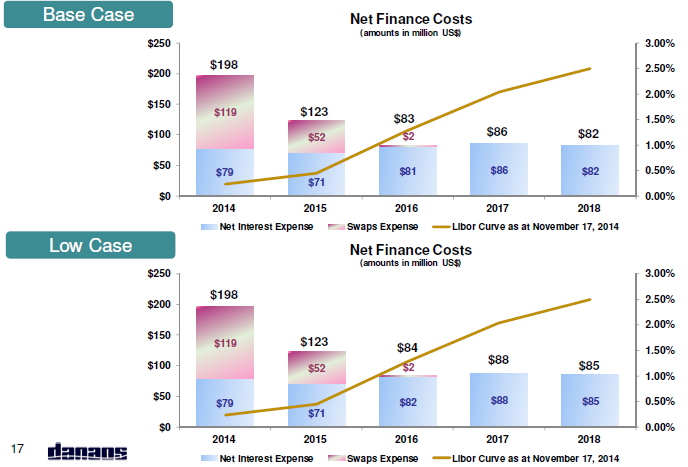
(Source: Danaos)
The retirement of this debt should benefit the net income and free cash flow.
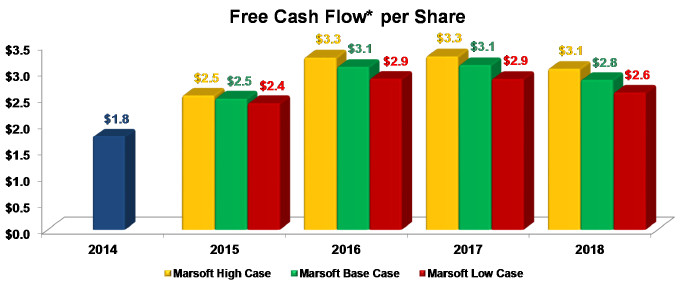
(Source: Danaos)
So what is the company going to do with this increased liquidity? In the Q4 earnings call, John Coustas, president and CEO, stated "our cash flow goes straight into debt repayment and for the time being we will continue on this kind of strategy."
So why is it so important to pay down debt?
Well, Mr. Coustas noted that, "in our filings we can consider paying dividends the moment that our debt to EBITDA goes below six."
Danaos could be approaching that threshold in the coming year.
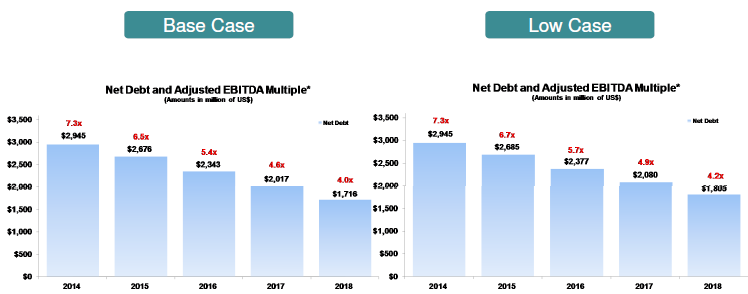
(Source: Danaos)
Even the more conservative estimate shows that target being achieved by 2016, meaning management should examine the possibility of returning capital to shareholders.
According to the company's most recent 20-F, there are 8 vessels with contracts scheduled to expire in 2015, and another 9 in 2016-2017. Danaos usually locks in long-term deals with staggered expiration in mind, which contributes to the stability and predictability. Currently, Danaos has 97% charter coverage in terms of operating revenues.
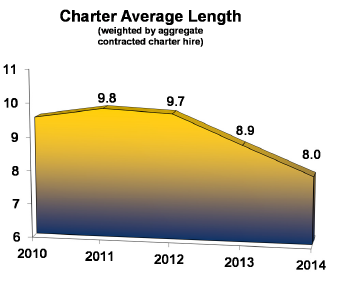
(Source: Danaos)
The expiration of these charters represents the potential for new deals to be forged, capturing this positive market momentum and turning it into favorable long-term charters. When asked about this possibility in the conference call Q&A session, Dr. Coustas stated that "we definitely believe that all the vessels that are rolling out this year will be rechartered at higher rates."
Conclusion
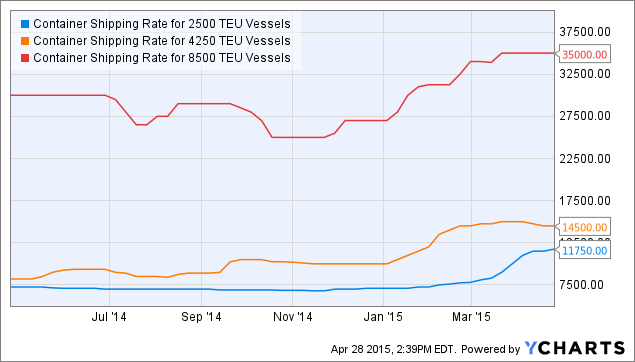
Q1 was good to Danaos and it looks like 2015 should continue that trend. Market rates for containerships remain acceptable as noted below.
After a long drought, it looks like things are getting interesting over at Danaos. The company has significantly less debt obligations going forward, which should free up cash to be utilized in even more debt reduction. The end result will be a debt-to-EBITDA multiple below 6, which is necessary for a dividend reinstatement. Of course, there is no guarantee that management will pursue that course of action.
I welcome all questions/comments and invite you to follow me on Seeking Alpha as I continue to cover all aspects of maritime trade. Thank you for reading.