Air Products and Chemicals, Inc. (NYSE:APD), founded in 1940, serves technology, energy, industrial, and healthcare customers globally with products, services, and solutions that include atmospheric gases, process and specialty gases, performance materials, equipment, and services. It is a supplier of hydrogen and helium and has built positions in markets, such as semiconductor materials, refinery hydrogen, natural gas liquefaction, and advanced coatings and adhesives. It has four segments: merchant gases, tonnage gases, electronics and performance materials, and equipment and energy. Air Products and Chemicals is a dividend aristocrat that has raised its dividend for 29 consecutive years.
A 10-year summary of Sales, Earnings Before Interest and Tax (EBIT), Earnings per share (EPS), yearly high and low stock price, corresponding high and low P/E (calculated by dividing the high and low price by the EPS for the year), and average P/E (average of high and low P/E) is shown below.
Key 10-year data for Air Products and Chemicals
| Year | Sales (Millions) | EBIT (Millions) | EPS | High Price | Low Price | High P/E | Low P/E | Avg P/E |
| 2011 | 10,082.00 | 1,661.00 | 5.59 | 98 | 75.2 | 17.5 | 13.5 | 15.5 |
| 2010 | 9,026.00 | 1,394.00 | 4.74 | 91 | 65 | 19.2 | 13.7 | 16.5 |
| 2009 | 8,256.20 | 836.60 | 3 | 83.4 | 46.2 | 27.8 | 15.4 | 21.6 |
| 2008 | 10,414.50 | 1,478.80 | 4.97 | 103.1 | 44.4 | 20.7 | 8.9 | 14.8 |
| 2007 | 9,148.20 | 1,327.60 | 4.57 | 101.8 | 69.3 | 22.3 | 15.2 | 18.7 |
| 2006 | 7,885.00 | 1,015.00 | 3.23 | 72.5 | 58.7 | 22.4 | 18.2 | 20.3 |
| 2005 | 7,673.00 | 986.20 | 3.04 | 65.2 | 54.1 | 21.4 | 17.8 | 19.6 |
| 2004 | 7,031.90 | 858.30 | 2.66 | 58.7 | 47.7 | 22.1 | 17.9 | 20.0 |
| 2003 | 6,297.30 | 565.40 | 1.79 | 52.4 | 38.5 | 29.3 | 21.5 | 25.4 |
| 2002 | 5,401.20 | 784.50 | 2.36 | 52 | 41 | 22.0 | 17.4 | 19.7 |
From these data, we can plot Sales, EBIT, and EPS versus Year, as shown in the chart below.
Sales (in Millions), EBIT (in Millions), and EPS versus Year for Air Products and Chemicals, 2002-2011
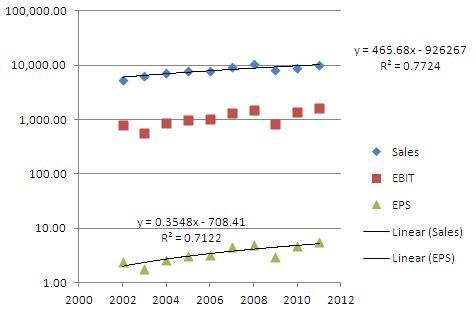
As evident from the chart above, APD has demonstrated reasonably predictable sales and earnings over the past 10 years, allowing us to predict EPS in the near future, say in five years (i.e. Year 2016), using the linear regression equation for EPS = 0.3548 (2016) - 708.41 = 6.8668. As a caveat, please note that APD's earnings appear to be mildly cyclical, with dips in 2003 and 2009, grossly consistently with 4-6 year business cycle. Since R-squared for the fit is 0.7122, the projected EPS is expected to explain only about 71% of the actual EPS in 5 years. The other 29% would depend on where in the business cycle we will be 5 years hence.
A conservative average P/E estimate for the stock can be obtained as follows:
Signature P/E: A well established stock has a signature P/E, an average P/E it commands in the market based on its business. We calculate this by averaging the Average P/E over the past 10 years, excluding any outliers (data points that fall significantly beyond the other data points). There are no significant outliers, so we average the Average P/Es from the past 10 years to arrive at a signature P/E of 19.2.
High P/E estimate: A conservative high P/E estimate can be calculated by averaging the five lowest High P/Es of the 10 High P/Es from the past 10 years. This gives 20.2.
Low P/E estimate: A conservative low P/E estimate can be calculated by averaging the five lowest Low P/Es of the 10 High P/Es from the past 10 years. Averaging the 5 lowest Low P/Es from the past 10 years gives 13.3.
Average P/E estimate: This takes the average of the High P/E estimate and the Low P/E estimate, as calculated above, to give a conservative estimate of an average P/E for the stock we can expect. Averaging 20.2 and 13.3 gives us 16.76. Note that this is a more conservative P/E estimate than the signature P/E of 19.2 as calculated above.
Target Price
Multiplying our EPS projection for 5 years hence by the average P/E estimate gives us a projected average price for the stock: $6.8668 * 16.76 = $115.10, which represents an annual stock price return of 6.34% from the current price of $90. When we add in the 2.58% dividend yield, the total return expected is an annualized 8.92%, which means an investment in APD today is expected to double in about 8 years.
Given a beta = 1.15 for APD, a risk-free rate = 2% (using the yield on 10-year Treasury bond as a benchmark), and estimated risk premium of about 5% for the general stock market, we have a discount rate = 2% + 1.15*(5%) = 7.75%. Applying this discount rate of 7.75%, our projected price of $115.10 in 5 years translates to a target price = $79 in today's dollars, which is 12% below the current price of $90 for the stock. For a good margin of safety, investors are well advised to buy only if the current price is at least 20% below the target price, which means a buy price of $63.
Market Expectation
What is the market's expectation of APD's growth rate given its current market price = $90? Since stock price = dividend * (1 + growth rate) / (discount rate - growth rate), we have growth rate = (stock price) * (discount rate) - dividend) / (stock price + dividend). Plugging in stock price = $90, dividend rate = $2.32, and discount rate = 7.75%, we get growth rate = 5%. This seems reasonable, given that APD has grown its revenue by 5%, its earnings by 10.6%, and its dividend by 10.7% annually over the past 5 years. The growth rate is supposed to slow down a bit as a company matures, so an implied market expected growth rate of 5% suggests that the stock is currently fairly valued.
Current P/E Compared With Signature P/E
As an additional consideration, we should also determine how the stock's current P/E compares with its signature P/E, since established stocks tend to revert back to their respective signature P/Es over the long term. Current EPS = 5.59, giving us a current P/E = 16.1. This is about 84% of the stock's signature P/E of 19.2. To provide some margin for error, we should look to buy when the current P/E is 80% or less of the stock's signature P/E, which means a buy price around $86.
Risk Index
Lastly, we calculate the Risk Index, calculated as (Current Price - Forecast Low Price)/ (Potential High Price - Forecast Low Price) to give an estimate of the risk-reward ratio. Risk index less than 20% is desired, which gives us +200% potential returns for every risk of 50% loss we assume.
The Forecast Low Price is calculated by multiplying the Low P/E estimate by the Forecast Low EPS, to give a conservative estimate of low price for the stock in 5 years, assuming zero EPS growth and low valuation. Forecast Low EPS is estimated by averaging the EPS over the past 5 years. For growth stocks with predictable earnings growth, EPS in 5 years should not be any lower than this conservative estimate. For APD, the forecast low EPS is equal to 4.574, so the Forecast Low Price = 13.3 * 4.574 = $60.98.
The Potential High Price is calculated by multiplying the High P/E estimate by the projected EPS in 5 years, giving us a price target in 5 years should the stock command a high P/E. For APD, this equals 20.2 * 6.8668 = $138.65.
Thus, the Risk Index = ($90 - $60.98) / ($138.65 - $60.98) = 37%. Since this is greater than 20%, the stock has an unfavorable reward to risk ratio at the current price. A pullback to $76 would give a risk index less than 20%.
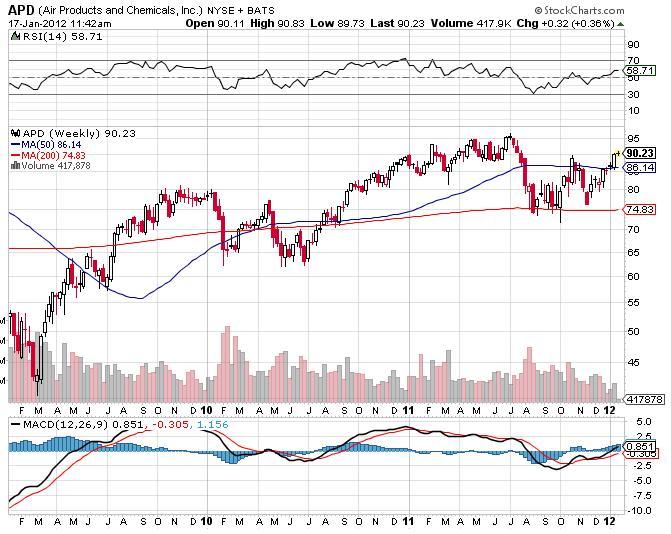
Technical consideration
As evident from the stock price chart below (from stockcharts.com), APD has support in the $75-80 range, and solid support in the $65 area. The stock has a short-term bullish uptrend and is trading currently near resistance area of $90-95.
Conclusion
Air Products and Chemicals, Inc., currently selling at $90, has a target price = $79. Its current P/E is close to its historic P/E, and its downside risk outweighs its upside potential. Therefore, I rate the stock a HOLD at the current price. A pullback to $76 near the intermediate term support area would be a good entry point to buy.
Disclosure: I have no positions in any stocks mentioned, and no plans to initiate any positions within the next 72 hours.
Disclaimer: Use this information as a starting point for your own due diligence, before buying any stock. If you do buy, be sure to read any annual reports (10-K) and quarterly reports (10-Q) to ensure that the fundamentals remain good and the stock is on target to reach its projected price. After holding for five years, repeat the analysis detailed in the article to decide whether to continue to hold, add to, or reduce your position.