Our favorite play is Gel (GEL); it sports a quarterly revenue growth of 44%, a strong quarterly earnings growth rate of 276%, a five-year dividend growth rate of 17.74%, a five-year dividend average of 6.60%, has consecutively increased dividends for eight years in a row, has a positive levered free cash flow rate of $81.6 million, and has increased its dividend from 42.75 cents to 44 cents. It also has a three-year total return of 206% and a five-year total return of 82.8%. As it is MLP, the high payout ratio should not be of concern. We cover this in more detail below.
Entergy (ETR) is a good second option; it has an operating cash flow of $2.89 billion, a payout ratio of only 42%, a five-year dividend growth rate of 9.24%, has consecutively increased its dividends for two years, and has a very strong quarterly earnings growth rate 27.4%. Investors could sell covered calls on both plays and in doing so open up a second stream of income.
Dividend investors should familiarize themselves with the following metrics as they can prove to be of tremendous value in the selection process.
Turnover Ratio lets you know the number of times a company's inventory is replaced in a given time period. It is calculated by dividing the cost of goods sold by average inventory during the time period studied. A high turn over ratio indicates that a company is producing and selling its good and services very quickly.
Current Ratio is obtained by dividing the current assets by current liabilities. This ratio allows you to see if the company can pay its current debts without potentially jeopardising their future earnings. Ideally, the company should have a ratio of 1 or higher.
Price to sales ratio is calculated by dividing the company's share price by its revenue per share. Generally, the smaller the ratio (less than 1.0) the better the investment since the investor is paying less for each unit of sales. However, there are exceptions as a company with a low price to sales ratio could be unprofitable. It is sometimes used to determine the relative valuation of a sector.
Price to cash flow ratio is obtained by dividing the share price by cash flow per share. It is a measure of the market's expectations of a company's future financial health. The effects of depreciation and other non cash factors are removed, and this makes it easier for investors to assess foreign companies in the same industry. This ratio also provides a measure of relative value like the price to earning's ratio.
Levered free cash flow is the amount of cash available to stock holders after interest payments on debt are made. A company with a small amount of debt will only have to spend a modest amount of money on interest payments, which in turn means that there is more money to send to shareholders in the form of dividends and vice versa. Individuals searching for other ideas might find this article to be of interest, "7 Stocks With Attractive Yields As High As 8.6%."
Operating cash flow is generally a better metric than earnings per share because a company can show positive net earnings and still not be able to properly service its debt; the cash flow is what pays the bills.
The payout ratio tells us what portion of the profit is being returned to investors. A pay out ratio over 100% indicates that the company is paying out more money to shareholders, then they are making; this situation cannot last forever. In general if the company has a high operating cash flow and access to capital markets, they can keep this going on for a while. As companies usually only pay the portion of the debt that is coming due and not the whole debt, this technique/trick can technically be employed to maintain the dividend for sometime. If the payout ratio continues to increase, the situation warrants close monitoring as this cannot last forever; if your tolerance for risk is a low, look for similar companies with the same or higher yields, but with lower payout ratios.
Price to free cash flow is obtained by dividing the share price by free cash flow per share. Higher ratios are associated with more expensive companies and vice versa; lower ratios are generally more attractive. If a company generated 400 million in cash flow and then spent 100 million on capital expenditure, then its free flow is $300 million. If the share price is 100 and the free cash flow per share are $5, then company trades at 20 times-free cash flow. This ratio is also useful because it can be used as a comparison to the average within the industry; this gives you an idea of how the company you are interested in compares to other companies within the industry.
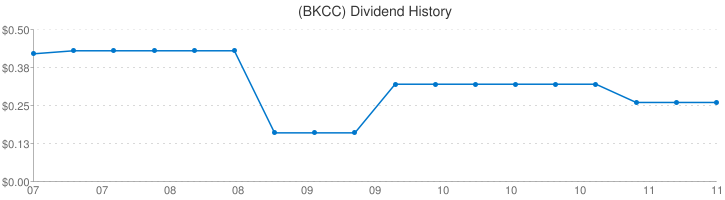
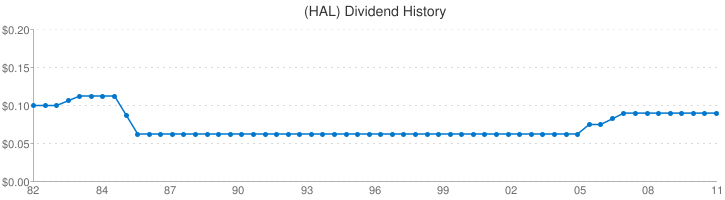
Two other notable plays are Blackrock Kelso Capital Corp (BKCC) and Halliburton Company (HAL) which sport yields of 11.2% and 1.1% respectively.
BKCC has an a quarterly revenue growth rate of 34%, a ROE of 10.8%, a three-year dividend growth rate of -2.52%, a total three-year return of 27%, a 5 year dividend average of 11%, a pay out ratio of 151% and has been paying dividends since 2007. It has levered free cash flow rate of -$7.7 million, a current ratio of 2.18 and it is trading roughly 50 cents below book value.
Net income for the past three years
- 2008= -$150 million
- 2009 = $67 million
- 2010= $71 million
- 2011= it stands at roughly $69.9 million and could top the $382 million mark.
Black Rock Kelso Capital Advisors LLC purchased 200, 000 shares in March at an average price of 10 per share. Director Jerrold Harris purchased 13,000 shares in March and May for an average price of 9.64-9.76 a share. The full list of transactions can be accessed here.
Halliburton has been paying dividends since 1947, has a three-year total return of 124%, a quarterly earnings growth rate of 25%, a quarterly revenue growth rate of 40%, a ROE of 24.5%, a current ratio of 2.82, a five-year dividend growth average of 3.87%, a very low payout ratio of 12% and a levered free cash flow rate of $ 538 million. It also has a price to tangible book of 2.83, price to cash flow of 8.10, and a five year EPS growth rate of -2.34.
Net income for the past three years
- 2008= $1.53 billion
- 2009 = $1.14 billion
- 2010= $1.83 billion
- 2011= it stands at roughly $1.94 billion and could top the $2.6 billion mark.
Important facts investors should be aware in regards to investing in MLP's and REITS
- Payout ratios are not that important when it comes to MLPS/REITS. Both are required by law to pay a majority of their cash flow as distributions. Payout ratios are calculated by dividing the dividend rate by the net income per share, and this is why the payout ratio for MLPs and REITS is often higher than 100%. The more important ratio to focus on is the cash flow per unit. If one focuses on the cash flow per unit, one will see that in most cases, it exceeds the distribution/dividend declared per unit/share.
- MLPs are not taxed like regular corporations because they pay out a large portion of their income to partners (as an investor you are basically a partner and are allocated units instead of shares) usually through quarterly distributions. The burden is thus shifted to the partners who are taxed at their ordinary income rates. As ordinary income tax rates of investors are typically lower than the income tax assessed on corporations, this arrangement is advantageous to the MLPs and generally most investors.
- MLPs issue a Schedule K-1 to their investors. If the MLP pays out distributions in excess of the income it generates, the distribution is classified as a "return of capital" and tax deferred until you sell your shares or units. Income from MLPs is generally taxable even in retirement accounts like 401KS and IRAs if the income generated is in excess of $1000.
Stock | Dividend Yield | Market Cap | Forward PE | EBITDA | Quarterly Revenue Growth | Beta | Revenue | Operating Cash flow |
9.60% | 216.58M | N/A | N/A | -1.70% | 1.04 | 14.47M | 19.42M | |
1.60% | 22.66B | 8.53 | 2.74B | 29.50% | 1.23 | 7.77B | 4.12B | |
7.80% | 837.66M | 11.35 | 77.16M | 18.80% | 1.28 | 146.88M | 58.95M | |
4.70% | 12.32B | 11.87 | 3.56B | 1.90% | 0.51 | 11.27B | 2.89B | |
5.80% | 2.09B | 20.03 | 60.68M | 44.10% | 0.55 | 2.89B | 95.54M |
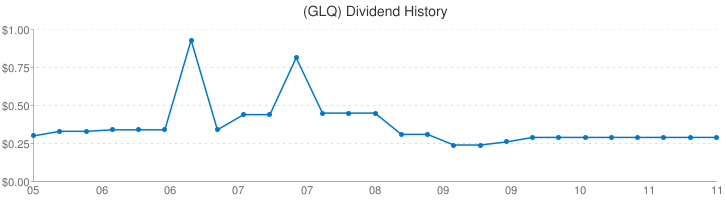
Clough Global Equity Fund (GLQ)
Industry: Holding and other Investment Offices
Key Ratios
• Price to sale N.A.
• Price to tangible book 0
• Price to cash flow N/A
• Price to free cash flow N.A.
• 5 year sales growth N.A.
• Inventory turnover 0
• Asset turnover 0
• ROE -6.30%
• Return on assets 1.15%
• 200 day moving average 12.61
• Total debt 147.00M
• Book value 13.58
• Qtrly Earnings Growth N/A
• Dividend yield 5 year Average 10.70%
• Dividend rate $ 1.16 %
• Payout ratio 387.00%
• Dividend growth rate 3 year average -6.81%
• Dividend growth rate 5 year average -6.37%
• Consecutive dividend increases 0 years
• Paying dividends since 2005
• Total return last 3 years 62.04%
• Total return last 5 years -7.77%
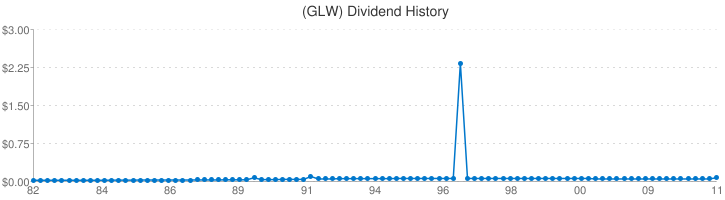
Corning, Inc. (GLW)
Industry: Electrical Equipment
GLQ sports a levered free cash flow of -$256 million, a quarterly earnings growth rate of 3.3% and current ratio of 4.61. Dividend increased from 5 cents to 7.5 cents.
Net income for the past three years
- 2008= $5.27 billion
- 2009 = $2.08 billion
- 2010= 3.558 billion
- 20011= net income so far is roughly $2.34 billion and could potentially top the $3.1-$3.3 billion mark.
Total cash flow from operating activities
- 2008= $2.12 billion
- 2009 =$2.07 billion
- 2010 =$3.83 billion
- 2011= so far it stands at 2.02 billion and could come in as high as $3.00-3.3 billion.
Key Ratios
• Price to sale 2.92
• Price to tangible book 1.09
• Price to cash flow 5.30
• Price to free cash flow 15.50
• 5 year sales growth 2.10
• Inventory turnover 4.00
• Asset turnover 0 .30
• ROE 16.72%
• Return on assets 4.26%
• 200 day moving average 14.31
• Total debt 2.31B
• Book value 13.79
• Qtrly Earnings Growth 3.30%
• Dividend yield 5 year Average 1.20%
• Dividend rate $ 0.30
• Payout ratio 11.00%
• Dividend growth rate 3 year average 4.17%
• Dividend growth rate 5 year average 0.00%
• Consecutive dividend increases 1 years
• Paying dividends since 1990
• Total return last 3 years 55.41%
• Total return last 5 years -20.46%
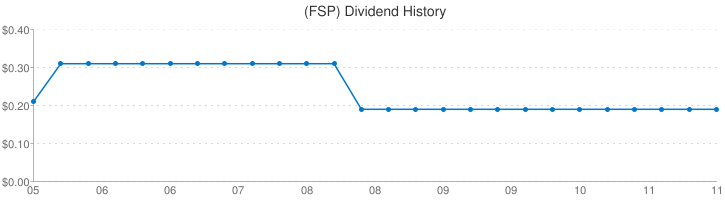
Franklin Street Properties Cor (FSP)
Industry: REITs
FSP has a levered free cash flow of- $12.42 million and a current ratio of 2.67.
Net income for the past three years
- 2008= $31.9 million
- 2009 = $27.8 million
- 2010= 22.0 million
- 20011= net income so far is roughly $38.3million and could potentially top the $41-$43 million mark.
Total cash flow from operating activities
- 2008= $64.3million
- 2009 =$69.3 million
- 2010 =$53.1million
- 2011= so far it stands at 44.8 million and could come in as high as $63 million
Key Ratios
• Price to sale 49.65
• Price to tangible book 0.90
• Price to cash flow 18.90
• Price to free cash flow 8.10
• 5 year sales growth -44%
• Inventory turnover N/A
• Asset turnover 0
• ROE 2.29%
• Return on assets 1.62%
• 200 day moving average 11.59
• Total debt 375.06M
• Book value 11.24
• Qtrly Earnings Growth -30.30%
• Dividend yield 5 year Average 7.10%
• Dividend rate $ 0.76 %
• Payout ratio 271.00%
• Dividend growth rate 3 year average -8.00%
• Dividend growth rate 5 year average -8.67%
• Consecutive dividend increases 0 years
• Paying dividends since 2005
• Total return last 3 years -1.69%
• Total return last 5 years -24.82%
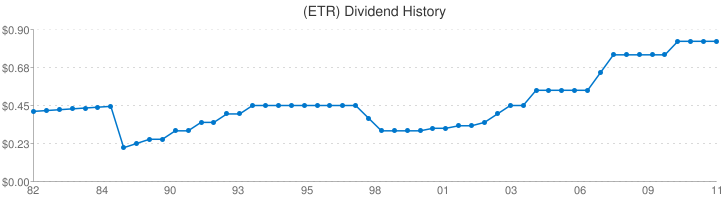
Entergy Corp. (ETR)
Industry: Electric Utilities
ETR sports a levered free cash flow of -$571 million and a current ratio of 1.00
Net income for the past three years
- 2008= $1.22 billion
- 2009 = $1.25 billion
- 2010= $1.27 billion
Total cash flow from operating activities
- 2008= $3.2 billion
- 2009 =$2.9 billion
- 2010 =$3.92 billion
Key Ratios
• Price to sale 1.09
• Price to tangible book 1.42
• Price to cash flow 3.90
• Price to free cash flow 7.50
• 5 year sales growth 0.30
• Inventory turnover 6.10
• Asset turnover 0 .30
• ROE 15.51%
• Return on assets 3.24%
• 200 day moving average 67.45
• Total debt 12.45B
• Book value 50.92
• Qtrly Earnings Growth 27.40%
• Dividend yield 5 year Average 3.80%
• Dividend rate $ 3.32 %
• Payout ratio 42.00%
• Dividend growth rate 3 year average 3.49%
• Dividend growth rate 5 year average 9.24%
• Consecutive dividend increases 2 years
• Paying dividends since 1988
• Total return last 3 years 3.06%
• Total return last 5 years -6.57%
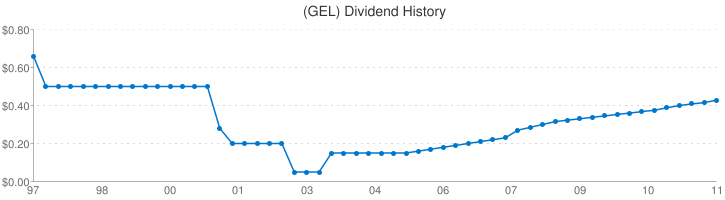
Genesis Energy L.P. (GEL)
Industry: Equipment & Services
GEL sports a levered free cash flow of $81.6 million and a current ratio of 1.45. Dividend increased from 42.75 cents to 44 cents.
Net income for the past three years
- 2008= $26.0 million
- 2009 = $8.0 million
- 2010= -$48.million
- 2011= it stands at roughly $43.3 million and could top the $62 million mark.
Total cash flow from operating activities
- 2008= $94.8 million
- 2009 =$90 million
- 2010 =$90.4 million
- 2011= it stands at $39.2 and could top the $62 million mark.
Key Ratios
• Price to sale 0.72
• Price to tangible book 5.37
• Price to cash flow 309
• Price to free cash flow 86.70
• 5 year sales growth 20.91
• Inventory turnover 35.30
• Asset turnover 2.00
• ROE -4.51%
• Return on assets 0.40%
• 200 day moving average 25.75
• Total debt 617.90M
• Book value 11.33
• Qtrly Earnings Growth 276.60%
• Dividend yield 5 year Average 6.60%
• Dividend rate $ 1.69 %
• Payout ratio 250.00%
• Dividend growth rate 3 year average 10.52%
• Dividend growth rate 5 year average 17.74%
• Consecutive dividend increases 8 years
• Paying dividends since 1997
• Total return last 3 years 206.91%
• Total return last 5 years 82.88%
Conclusion
BKCC, HAL all sport high betas which makes them ideal candidates for covered writes; selling covered calls opens up a second stream of income and if implemented successfully can sometimes generate higher returns than the dividends paid out by an individual stock. GLQ, GLW and FSP also sport high betas though not as high as BKCC and HAL and could also make for good covered write candidates.
The markets are rather overbought, and long-term investors would do well to wait for a strong pull back before coming large sums of money to this market.
All charts sourced from dividata.com
Disclosure: I have no positions in any stocks mentioned, and no plans to initiate any positions within the next 72 hours.
Disclaimer: This list of stocks is meant to serve as a starting point. Please do not treat this as a buying list. It is very important that you check the finer details in each of the mentioned plays before investing any capital in them. Some investors are happy with taking enormous amounts of risks, while others are bothered by the slightest degree risk; it is imperative that you do your due diligence and then determine if any of the above plays meet with your risk tolerance levels. The Latin maxim caveat emptor applies-let the buyer beware.