By Paul Tait
WebMD (WBMD) reported exceptional growth in earnings and traffic in 2014, one of its most impressive years in company history. During the year, the firm experienced revenue growth of 13% and an EBITDA increase of 29% from the year prior. Traffic from unique users and page views increased 22% during the year. The firm is still growing rapidly as WebMD's first quarter results revealed that revenue increased 7% and EBITDA increased 17% from the prior year's period. CEO David Schlanger attributed the growth to an increase in mobile advertising revenue which accounted for 34% of its total advertising revenue in 2014.
However, WebMD is facing some new problems as of late, with new rivals coming to the fore. As of February 2015, Google (GOOG) (GOOGL) has been providing health information when users search for a condition, such as symptoms, treatments and longevity. One out of every 20 Google searches is health related. For example, this search for "Bronchitis" shows Google's offering. Users may be surprised to see that WebMD isn't the first site listed. This new development could seriously affect WebMD's top line as advertisers may begin to look elsewhere. The firm generates the majority of its revenue from advertising.
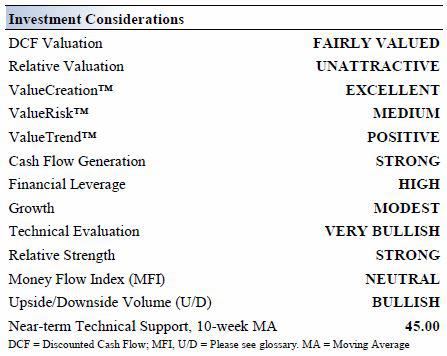
Nevertheless, WebMD has had solid traffic momentum through 2014 and is delivering substantial returns on capital and impressive free cash flow. The firm is listed as one of our highest rated Economic Castles, a noteworthy accomplishment. Let's dig deeper into some other investment considerations as well as derive our fair value estimate for shares.
WebMD's Investment Considerations
Investment Highlights
• WebMD is a leading provider of health information services to consumers, physicians and other healthcare professionals, employers and health plans through public and private online portals, mobile platforms and health-focused publications.
• Healthcare consumers are increasingly seeking to educate themselves online about health-related issues, motivated in part by the larger share of healthcare costs they are being asked to bear. WebMD is the go-to objective and trusted online source.
• The WebMD Health Network reached ~183 million monthly unique visitors and delivered ~14.25 billion page views in 2014. Both measures are increasing at a nice double-digit clip. Traffic to the firm's online portals averaged ~6.2 million physician sessions per month, advancing at a low-double-digit annual pace.
• WebMD does not charge membership dues or usage fees. The company runs an advertising-based business model, and as a result, is dependent on the ad budgets of companies desiring to reach physicians and other healthcare professionals.
• Innovation continues at WebMD, and the biopharma market remains very healthy. Revenue from biopharma and medical device customers is growing at a 12%-15% clip.
Business Quality
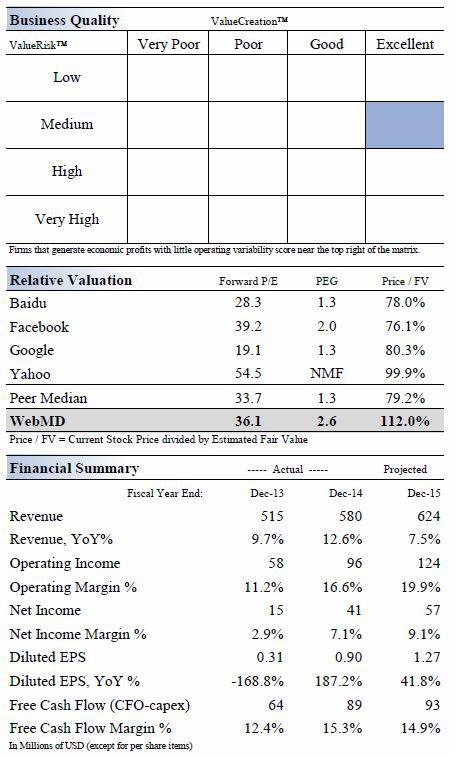
Economic Profit Analysis
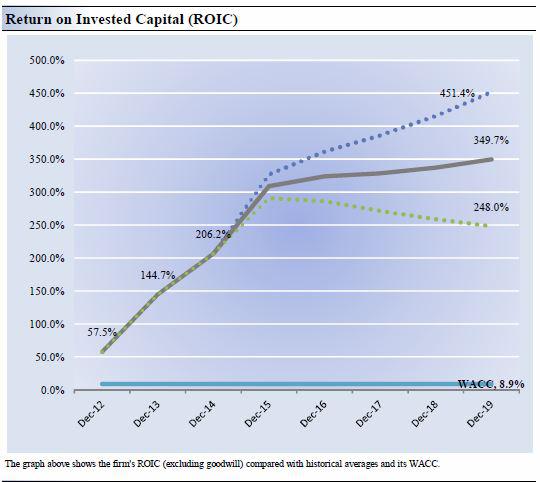
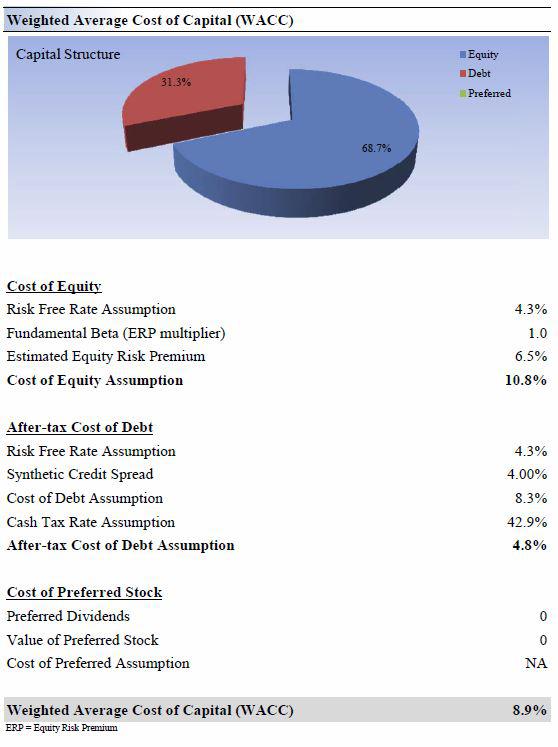
In our opinion, the best measure of a firm's ability to create value for shareholders is expressed by comparing its return on invested capital with its weighted average cost of capital. The gap or difference between ROIC and WACC is called the firm's economic profit spread. WebMD's three-year historical return on invested capital (without goodwill) is 136.1%, which is above the estimate of its cost of capital of 8.9%.
As such, we assign the firm a ValueCreation rating of EXCELLENT. In the chart below, we show the probable path of ROIC in the years ahead based on the estimated volatility of key drivers behind the measure. The solid gray line reflects the most likely outcome, in our opinion, and represents the scenario that results in our fair value estimate.
Cash Flow Analysis
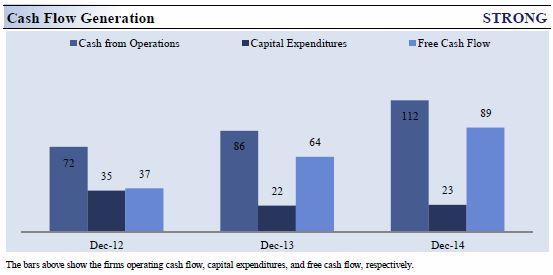
Free cash flow generation has improved nicely over the past few years at WebMD. Firms that generate a free cash flow margin (free cash flow divided by total revenue) above 5% are usually considered cash cows. WebMD's free cash flow margin has averaged about 11.9% during the past three years. As such, we think the firm's cash flow generation is relatively STRONG.
The free cash flow measure shown above is derived by taking cash flow from operations less capital expenditures and differs from enterprise free cash flow (FCFF), which we use in deriving our fair value estimate for the company. At WebMD, cash flow from operations increased about 55% from levels registered two years ago, while capital expenditures fell about 34% over the same time period.
In the first quarter of 2015, WebMD reported cash from operations of $24.4 million and capital expenditures of $3.7 million, resulting in free cash flow of $20.7 million.
Valuation Analysis
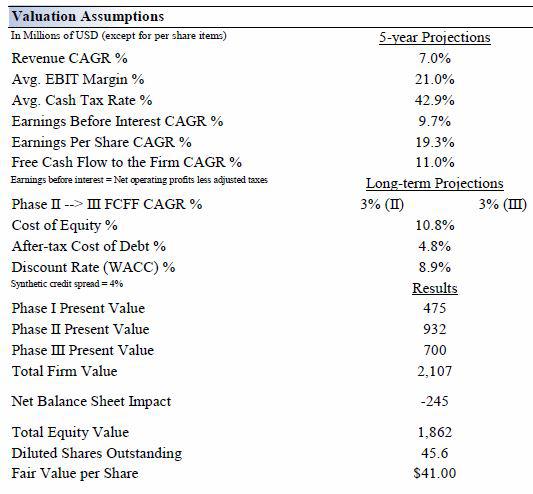
Below we outline valuation assumptions that allow us to derive a fair value estimate for shares. There's no need to turn and cough in this examination, so let's get started.
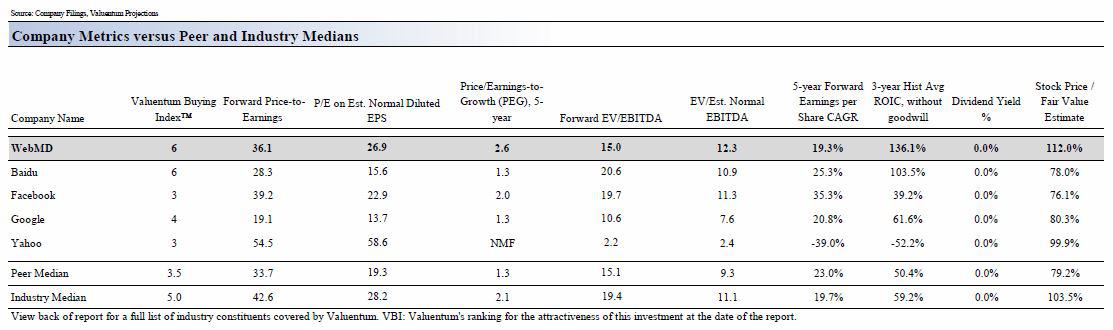
Our discounted cash flow model indicates that WebMD's shares are worth between $31-$51 each. Shares are currently trading at ~$46, in the upper half of our fair value range. This indicates that we feel there is more downside risk than upside potential based on our fair value estimate.
The margin of safety around our fair value estimate is driven by the firm's MEDIUM ValueRisk rating, which is derived from the historical volatility of key valuation drivers. The estimated fair value of $41 per share represents a price-to-earnings (P/E) ratio of about 45.7 times last year's earnings and an implied EV/EBITDA multiple of about 16.7 times last year's EBITDA.
Our model reflects a compound annual revenue growth rate of 7% during the next five years, a pace that is higher than the firm's three-year historical compound annual growth rate of 1.3%. Our model reflects a five-year projected average operating margin of 21%, which is above WebMD's trailing three-year average.
Beyond year five, we assume free cash flow will grow at an annual rate of 3% for the next 15 years and 3% in perpetuity. For WebMD, we use a 8.9% weighted average cost of capital to discount future free cash flows.
Margin of Safety Analysis
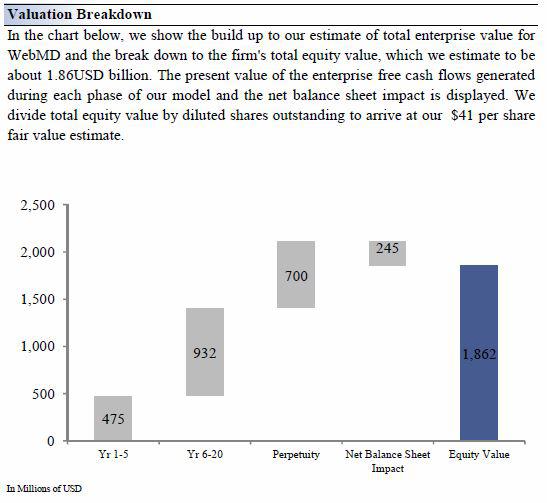
Our discounted cash flow process values each firm on the basis of the present value of all future free cash flows. Although we estimate the firm's fair value at about $41 per share, every company has a range of probable fair values that's created by the uncertainty of key valuation drivers (like future revenue or earnings, for example).
After all, if the future was known with certainty, we wouldn't see much volatility in the markets as stocks would trade precisely at their known fair values. Our ValueRisk rating sets the margin of safety or the fair value range we assign to each stock. In the graph above, we show this probable range of fair values for WebMD.
We think the firm is attractive below $31 per share (the green line) but quite expensive above $51 per share (the red line). The prices that fall along the yellow line, which includes our fair value estimate, represent a reasonable valuation for the firm, in our opinion.
Future Path of Fair Value
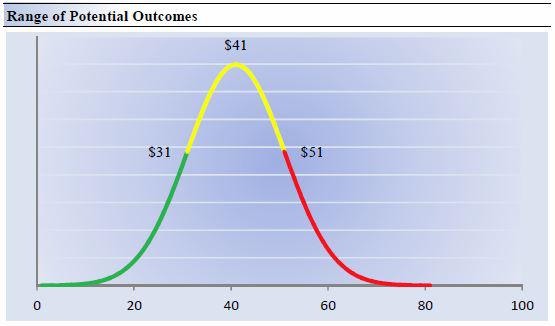
We estimate WebMD's fair value at this point in time to be about $41 per share. As time passes, however, companies generate cash flow and pay out cash to shareholders in the form of dividends. The chart above compares the firm's current share price with the path of WebMD's expected equity value per share over the next three years, assuming our long-term projections prove accurate.
The range between the resulting downside fair value and upside fair value in Year 3 represents our best estimate of the value of the firm's shares three years hence. This range of potential outcomes also is subject to change over time, should our views on the firm's future cash flow potential change.
The expected fair value of $56 per share in Year 3 represents our existing fair value per share of $41 increased at an annual rate of the firm's cost of equity less its dividend yield. The upside and downside ranges are derived in the same way, but from the upper and lower bounds of our fair value estimate range.
Wrapping Things Up
WebMD has its share of investment merits.
The company has become a trusted online source for health information services and traffic and page views continue to advance at a solid low-double-digit annual pace. The firm generates the vast majority of its revenue from advertising, and the news that 34% of 2014 advertising revenue came from mobile advertising is encouraging. Perhaps most attractive about the company is its ability to create value for shareholders through high returns on investment. Its ROIC-less-WACC spread is among the highest across our coverage universe.
Despite the recent momentum in its businesses, we do not find WebMD to be an attractive investment consideration at this time. We'd need to see shares trading at a significant discount to our fair value, as well as an improvement in the company's relative valuation, before considering a position. WebMD currently registers a 6 on the Valuentum Buying Index.