For those of you keeping score at home, the S&P 500 has changed direction no fewer than 14 times in 2015 alone. This means traders are "going the other way" on average, about twice a month. And if this stat doesn't drive home the choppiness on display at the corner of Broad and Wall these days, perhaps this next little tidbit will. I saw a report on Friday that the S&P 500 has crossed is 50-day moving average - the generally accepted "state of the trend" in the stock market - a total of 27 times in the last 6 months. Can you say, A.D.D.?
Lest we forget, it was only 12 days ago that the latest Greek drama held the market's attention. While the decline didn't turn out to be meaningful this time around, the fear that Greece's new left-wing, anti-austerity party would do something really stupid and blow up the Eurozone in the process was the talk of the town and wound up holding stocks hostage.
But then the stupidity ended as Alexis Tsipras and friends figured out they held no chips, and the latest in a long line of Greek worries ended. As one might have expected, stocks then breathed a sigh of relief and moved back up toward the all-time highs.
However, as has been the trend for quite some time now, whenever the S&P approaches its high-water mark, traders tend to find a reason to go the other way. So as the S&P flirted with a fresh new high on July 20th, I wrote that it was likely time to Cue the Negative News.
Sure enough, traders wasted little time in moving on to the next worry.
S&P 500 Index - Daily
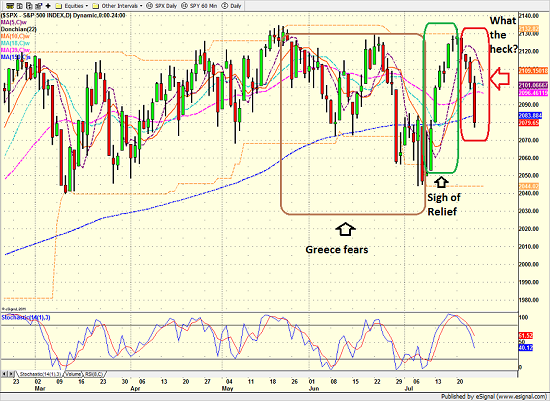
Four days after it looked as if the bulls might be attempting a comeback, fear is back in the game and the venerable blue-chip index appears to be slashing its way back through the trading range.
So what gives? Why are traders once again freaking out and sending stocks down in earnest?
And We're Back To Worrying...
Take a moment to peruse the following charts. These are weekly charts of various indices over the past four and one-half years. See if you can't spot the problem here...
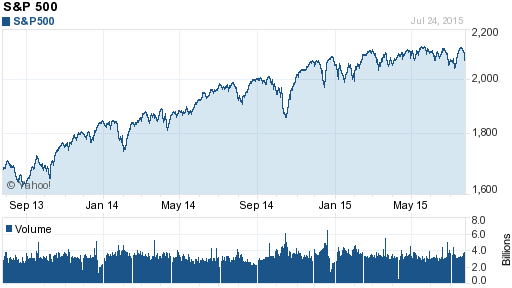
S&P 500 Index - Weekly
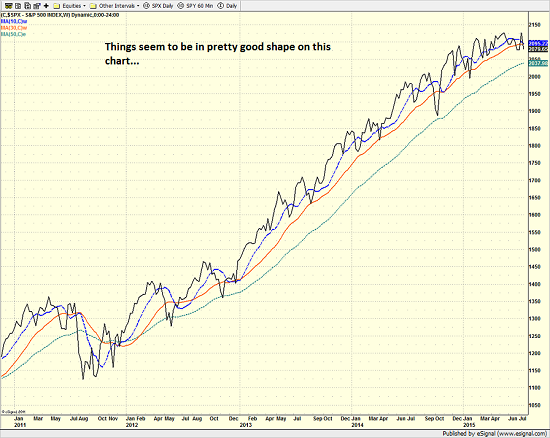
Well, to be honest, there really doesn't seem to be much of a problem on the chart above. While it is clear that the momentum of the uptrend continues to wane, the chart of the S&P 500 is still moving from the lower left to the upper right.
However, this is most certainly NOT the case for Oil.
United States Oil Fund (NYSEARCA:USO) - Weekly
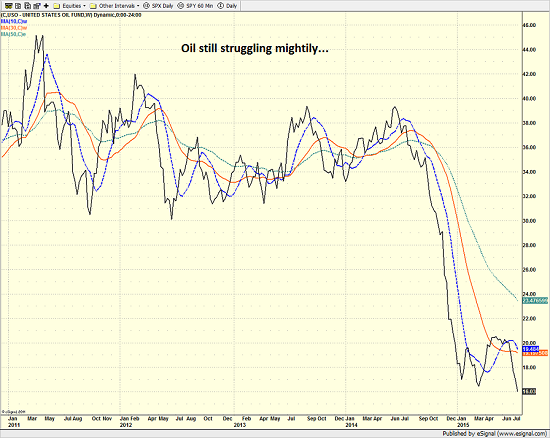
Don't look now fans, but the price of oil just broke down to fresh weekly lows. However, it is important to realize that the current worry in the market may go beyond oil. Take a look at the chart of the PowerShares DB Commodity Index ETF (NYSE: DBC).
PowerShares DB Commodity Index - Weekly
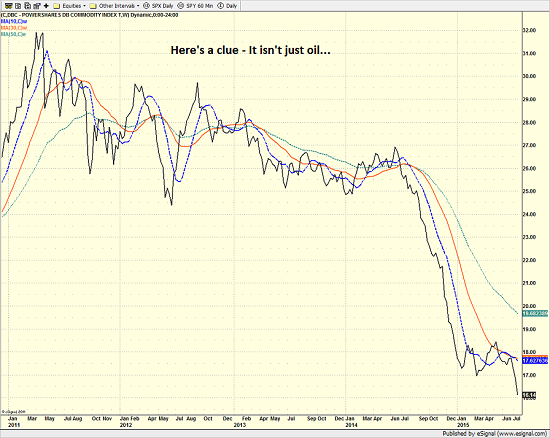
Note that commodities in general are actually in worse shape than oil as the weekly chart of the DBC looks to be launching into a new leg lower.
What Does "Doctor Copper" Have to Say?
It is said that copper has a PhD in economics and is a key "tell" in terms of the state of the global economy. So what does the "doctor" have to say?
iPath Bloomberg Copper ETF (NYSEARCA:JJC) - Weekly
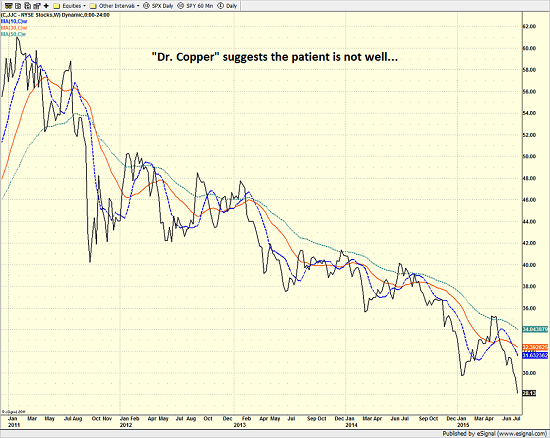
Ouch! It would appear that Dr. Copper is telling us the patient has serious health issues - and has for quite some time as this is a textbook example of a long-term downtrend.
And just in case you think the problem is copper-specific, check out the chart of steel.
Market Vectors Steel ETF (NYSEARCA:SLX) - Weekly

Should we then conclude that the current worry in the market is the state of the global economy?
Blame It On The Dollar?
Before we jump to conclusions, let's remember that traders can play an important role in the "story" that may emanate from the charts. For example, everybody knows that commodities of all shapes and sizes tend to move inversely to the dollar. So, some argue that the worries about the global economy are overblown and that it's really just traders playing their games with the buck.
PowerShares DB US Dollar ETF (NYSEARCA:UUP) - Weekly
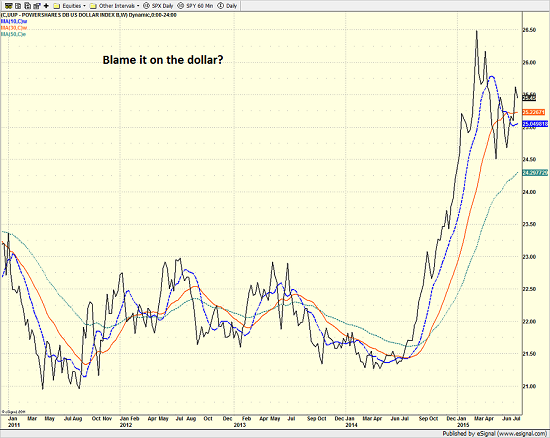
To which, I'd like to respond, "Uh, not so much."
After comparing the chart of the dollar to the rest of the commodities, it becomes quite clear that commodities were a problem long before the big spike in the dollar.
Oh, and the fact that the dollar is not breaking to new highs as commodities are breaking to new lows suggests that the greenback is not the sole culprit here.
The Bottom Line
Instead of blaming traders or computer algorithms for a change, I think we have to admit that there is a bigger problem at hand here. The bottom line appears to be that the combination of slowing global growth (look no further than China here) and the end of the secular bull market in commodities is the real problem.
So, is this the big one? Will an ongoing decline in commodities soon infect the stock market? Is THIS the real problem that will lead to the crunch in stocks that everyone on the planet seems to be waiting on?
To review, we are not seers of all things global macro. We do NOT invest based on an opinion or point of view. No, we prefer to let the weight of the indicator evidence guide us. And on that score, with commodities breaking down, high yields struggling, and three of our four long-term risk management models all waving warning flags, we will continue to say that risk remains elevated at this time.
This Morning's Pre-Game Indicators
Here are the Pre-Market indicators we review each morning before the opening bell...
Major Foreign Markets:
Japan: -0.95%
Hong Kong: -3.09%
Shanghai: -8.47%
London: -0.61%
Germany: -2.10%
France: -2.10%
Italy: -2.12%
Spain: -1.21%
Crude Oil Futures: -$0.52 to $47.62
Gold: +$4.80 at $1090.30
Dollar: higher against the yen, lower vs. euro and pound
10-Year Bond Yield: Currently trading at 2.239%
Stock Indices in U.S. (relative to fair value):
S&P 500: -6.70
Dow Jones Industrial Average: -77
NASDAQ Composite: -19.57
Thought For The Day:
"The secret of life is honesty and fair dealing. If you can fake that, you've got it made." - Groucho Marx
Current Market Drivers
We strive to identify the driving forces behind the market action on a daily basis. The thinking is that if we can both identify and understand why stocks are doing what they are doing on a short-term basis; we are not likely to be surprised/blind-sided by a big move. Listed below are what we believe to be the driving forces of the current market (Listed in order of importance).
1. The State of Global Economic Growth
2. The State of the Earnings Season
3. The State of Fed/ECB/PBoC Policy
4. The State of the U.S. Economy
The State of the Trend
We believe it is important to analyze the market using multiple time-frames. We define short-term as 3 days to 3 weeks, intermediate-term as 3 weeks to 3 months, and long-term as 3 months or more. Below are our current ratings of the three primary trends:
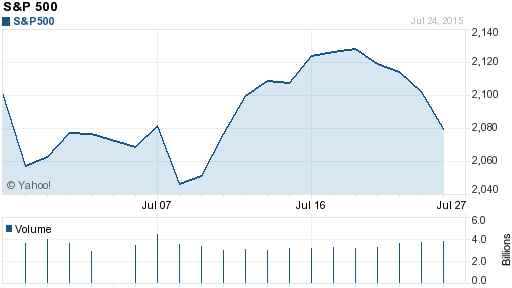
Short-Term Trend: Moderately Negative
(Chart below is S&P 500 daily over past 1 month)
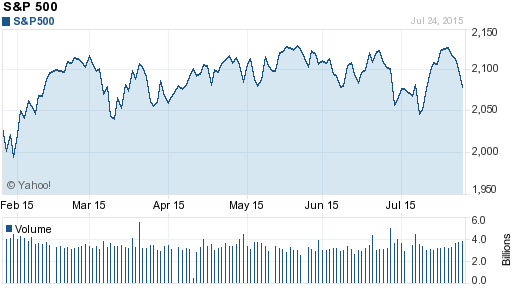
Intermediate-Term Trend: Neutral
(Chart below is S&P 500 daily over past 6 months)
Long-Term Trend: Positive
(Chart below is S&P 500 daily over past 2 years)
Key Technical Areas:
Traders as well as computerized algorithms are generally keenly aware of the important technical levels on the charts from a short-term basis. Below are the levels we deem important to watch today:
- Key Near-Term Support Zone(s) for S&P 500: 2040
- Key Near-Term Resistance Zone(s): 2135
The State of the Tape
Momentum indicators are designed to tell us about the technical health of a trend - I.E. if there is any "oomph" behind the move. Below are a handful of our favorite indicators relating to the market's "mo"...
- Trend and Breadth Confirmation Indicator (Short-Term): Negative
- Price Thrust Indicator: Negative
- Volume Thrust Indicator: Negative
- Breadth Thrust Indicator: Negative
- Intermediate-Term Bull/Bear Volume Relationship: Moderately Negative
- Technical Health of 100+ Industry Groups: Moderately Positive
The Early Warning Indicators
Markets travel in cycles. Thus we must constantly be on the lookout for changes in the direction of the trend. Looking at market sentiment and the overbought/sold conditions can provide "early warning signs" that a trend change may be near.
- S&P 500 Overbought/Oversold Conditions:
- Short-Term: Moderately Oversold
- Intermediate-Term: Moderately Oversold
- Market Sentiment: Our primary sentiment model is Neutral.
The State of the Market Environment
One of the keys to long-term success in the stock market is stay in tune with the market's "big picture" environment in terms of risk versus reward.
- Weekly Market Environment Model Reading: Neutral