Introduction
There has been speculation in the press, including readers' comments to numerous Seeking Alpha articles, that Chesapeake Energy (NASDAQ:CHK) is facing a liquidity crisis due to low energy prices and their high debt level. As an investor in CHK, I decided to investigate what the impact would be to Chesapeake's future production, cash flow and cash balance, if current low oil and gas prices continued for the next five years.
In a May 6, 2015 press release, Doug Lawler, Chesapeake's CEO, stated, "We remain on target to balance our capital spending and our cash flow by year-end, and the capital efficiencies that we are seeing in each of our operating areas are helping to strengthen that cash flow." In my analysis I have assumed that CHK succeeds in meeting this goal by year-end, and that capital expenditures would be balanced against discretionary cash flow in subsequent years.
Outlook for 2015
I have used Chesapeake's own outlook for 2015, as published on their web site and copied below, to derive a forecast cash flow and cash balance for year ending 2015.
SCHEDULE "A"
CHESAPEAKE ENERGY CORPORATION
MANAGEMENT'S OUTLOOK AS OF MAY 6, 2015
Chesapeake periodically provides management guidance on certain factors that affect the company's future financial performance.
| Year Ending 12/31/2015 | |||||
Adjusted Production Growth (1) | 1% | - 3% | |||
Absolute Production | |||||
Liquids - mbbls | 62 | - 64 | |||
Oil - mbbls | 38.5 | - 39.5 | |||
NGL(2)- mbbls | 23.5 | - 24.5 | |||
Natural gas - bcf | 1,025 | - 1,040 | |||
Total absolute production - mmboe | 233 | - 237 | |||
Absolute daily rate - mboe | 640 | - 650 | |||
Estimated Realized Hedging Effects (3) (based on 4/30/15 strip prices): | |||||
Oil - $/bbl | $19.33 | ||||
Natural gas - $/mcf | $0.32 | ||||
Estimated Basis/Gathering/Marketing/Transportation Differentials to NYMEX Prices: | |||||
Oil - $/bbl | $7.00 | - 9.00 | |||
Natural gas - $/mcf | $1.70 | - 1.90 | |||
NGL - $/bbl | $49.00 | - 51.00 | |||
Fourth quarter minimum volume commitment (MVC) estimate ($ in millions) | ($180) | - (200) | |||
Operating Costs per Boe of Projected Production: | |||||
Production expense | $4.50 | - 5.00 | |||
Production taxes | $0.45 | - 0.55 | |||
General and administrative (4) | $1.45 | - 1.55 | |||
Stock-based compensation (noncash) | $0.20 | - 0.25 | |||
DD&A of natural gas and liquids assets | $9.50 | - 10.50 | |||
Depreciation of other assets | $0.60 | - 0.70 | |||
Interest expense (5) | $1.10 | - 1.20 | |||
Other ($ millions): (6) | |||||
Marketing, gathering and compression net margin | ($40 | - 60) | |||
Net income attributable to non-controlling interests and other (7) | ($30 | - 50) | |||
Book Tax Rate | 25% | - 30% | |||
Capital Expenditures ($ in millions) (8) | $3,000 | - 3,500 | |||
Capitalized Interest ($ in millions) | $475 | ||||
Total Capital Expenditures ($ in millions) | $3,475 - 3,975 | ||||
- Based on 2014 production of 622 mboe/day adjusted for 2014 sales and the potential sale of Cleveland Tonkawa assets in 2015.
- Assumes ethane recovery in the Utica to fulfill Chesapeake's pipeline commitments, no ethane recovery in the Powder River Basin and partial ethane recovery in the Mid-Continent and Eagle Ford.
- Includes expected settlements for commodity derivatives adjusted for option premiums. For derivatives closed early, settlements are reflected in the period of original contract expiration.
- Excludes expenses associated with stock-based compensation.
- Excludes unrealized gains (losses) on interest rate derivatives.
- Includes revenue and operating expenses and excludes depreciation and amortization of other assets.
- Net income attributable to non-controlling interests of Chesapeake Granite Wash Trust and CHK Cleveland Tonkawa L.L.C.
- Includes capital expenditures for drilling and completion, leasehold, geological and geophysical costs and other property and plant and equipment.
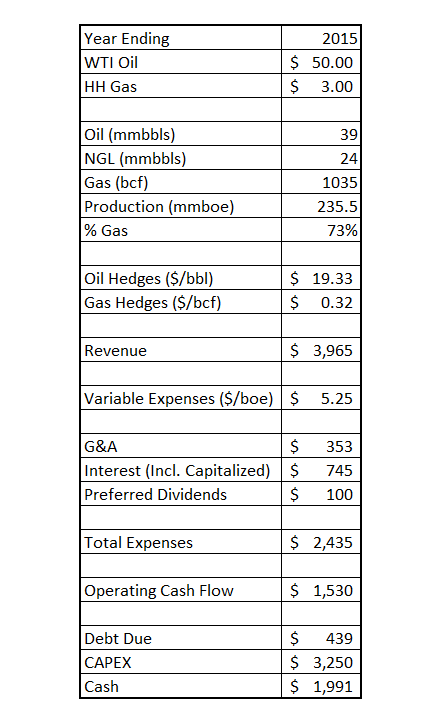
The spreadsheet below shows the derivation of 2015 operating cash flows and their impact on balance sheet cash and debt, given assumed capital expenditures from Chesapeake's 2015 outlook. Revenue is calculated by multiplying the midpoints for oil, natural gas and NGL yearly production totals by the prices received. Prices received are based on an assumed yearly average NYMEX price of $50/bbl for oil and $3.00/mcf for natural gas less midpoint differentials plus estimated realized hedging effects for oil and natural gas.
The midpoints for variable expenses of $5.25/boe for production and production taxes are multiplied by total production of 235.5 mmboe and then added to the midpoint of fixed expenses for general and administrative, interest and preferred dividends to obtain total expenses. The available operating cash flow is then the difference between revenue and total expenses.
Since Chesapeake did not plan to balance cash flow and capital expenditures during this year, but to only reach that target at year end, the excess of the forecast 2015 capital expenditure over operating cash flow is balanced by reducing the cash balance that existed at the beginning of 2015. Also deducted from the beginning 2015 cash balance is the total debt that comes due during the year. For 2015, this is the debt plus interest penalty that CHK owes as a result of losing a lawsuit over early redemption of 2019 bonds.
Estimation of Future Years' Production
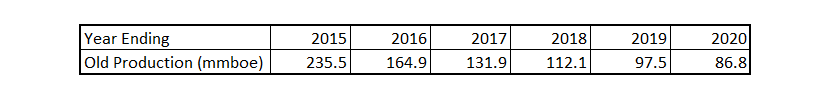
For any given year, the total production is the sum of declining production from wells drilled and completed in previous years plus production from wells drilled and completed in the current year. Chesapeake provides an estimate of decline rates of their year ending 2014 production for future years in their 2014 10k: "Our annual net decline rate on producing properties is projected to be 30% from 2015 to 2016, 20% from 2016 to 2017, 15% from 2017 to 2018, 13% from 2018 to 2019 and 11% from 2019 to 2020. This allows calculation of the estimated contribution from year ending 2015's production of 235.5 mmboe for subsequent years. This is labeled as "Old Production" in the chart below.
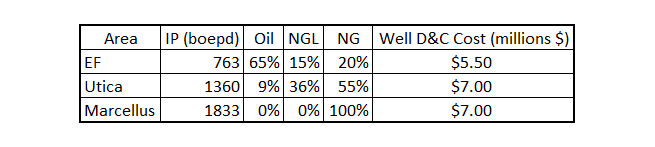
To estimate new production for a given year, the number of wells that could be drilled and completed given an available cash flow is calculated. Cash flow available for drilling and completion was estimated as 95% of operating cash flow, after any deductions required for debt redemption. An average well cost and initial production (IP) rate were determined by assuming half the new wells were from the Eagle Ford and the other half from a mixture of Marcellus and Utica, as required to maintain an 18% oil, 11% NGL and 71% gas production split (based on actual 1st quarter 2015 production). This resulted in an average well cost of $6.25 million and an IP rate, on the conservative side, of 1000 boepd. The following well statistics were used (from CHK presentations):
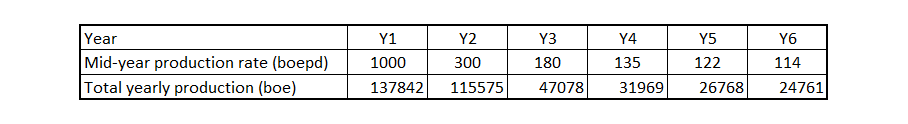
All new wells were assumed to decline exponentially as follows:
1st year: 70%, 2nd year: 40%, 3rd year: 25%, 4th year: 10%, 5th year and thereafter: 6%
Also, all new wells for a year were assumed to be completed mid-year. Because of the exponential decline and mid-year assumption, it was estimated that about 65% of the new wells' production would be attributed to the year in which the wells were drilled and completed, with the remaining 35% attributed to the subsequent year. The average production rate during a year was estimated to be about 58% of the beginning rate. Therefore for a typical 1000 boepd well, the following mid-year production rates and total production per year were calculated:
Outlook for Next Five Years
With the above methodology for calculating "New Production", the spreadsheet for future years' production, cash flows and cash balances can be completed.
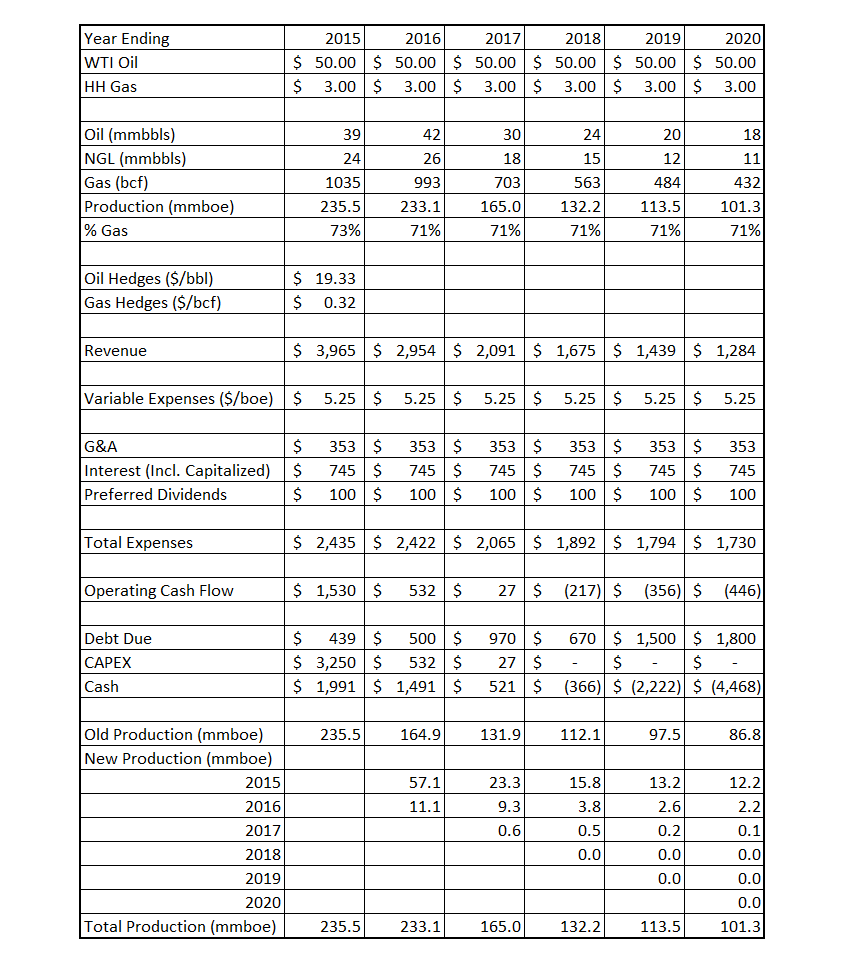
As can be seen from the spreadsheet, in 2018 Chesapeake's Operating Cash Flow goes negative, so for this and subsequent years, no new production is drilled and cash flow deficits and debt redemptions are financed using Chesapeake's $4.0 billion revolver (which would also be overdrawn in 2020). Alternatives to finance these deficits would be asset and/or new bond sales.
Outlook for Next Five Years with More Realistic Oil and Natural Gas Prices
If a more realistic forecast for future oil and natural gas prices is assumed, a totally different story emerges. Here it is assumed that the price ratio of gas to oil remains fixed at 0.6 and that the price for WTI oil gradually increases to $75.00/bbl over the next three years.
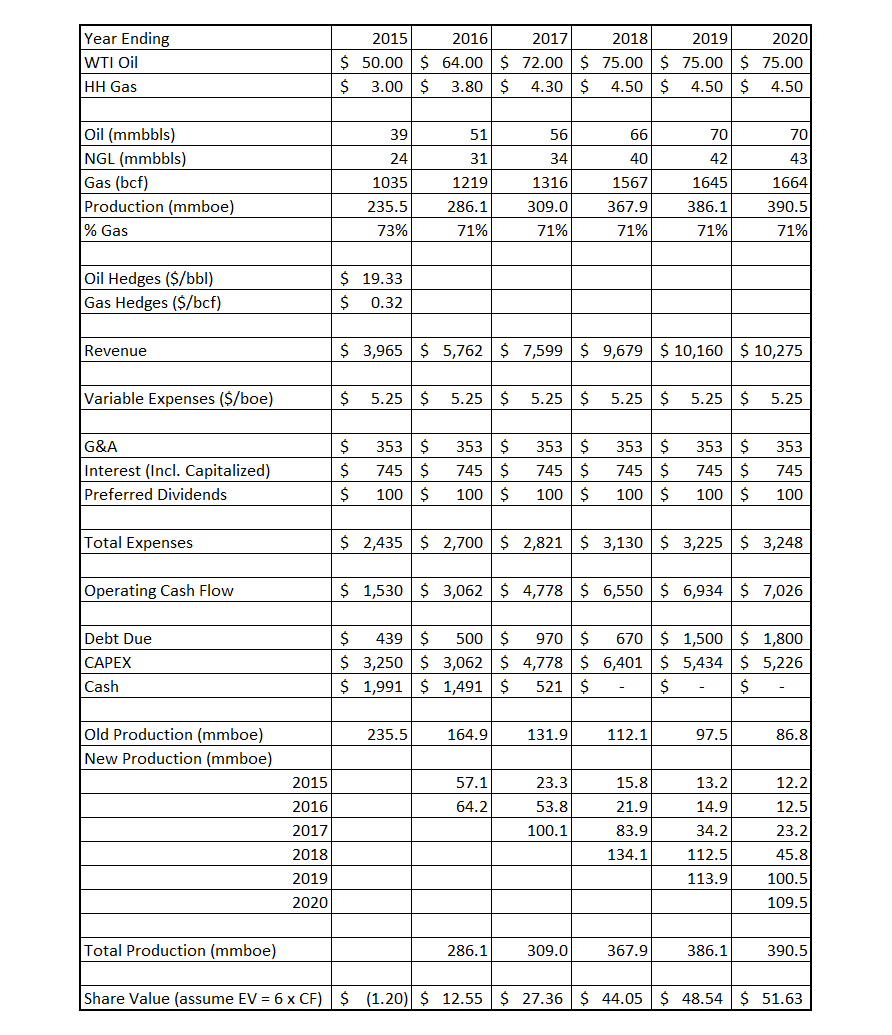
As can be seen for these assumptions, total production continually increases. Also an estimated share price row has been added, where enterprise value (EV) is assumed to be 6 times operating cash flow. Share price is then calculated as EV less debt outstanding net of cash, divided by shares outstanding.