One of the most important decisions for investors is their approach towards asset allocation. With a number of different asset classes and subclasses available, this task can easily become overwhelming. In an article published just over two years ago, I analyzed from the risk perspective 9 popular asset allocation strategies designed by famous investors. This time I would like to review the same strategies and compare how they have performed since my previous publication.
Portfolio specifications come from Meb Faber's website and they have been replicated using ETFs that most closely match the defined categories. All the statistics have been obtained from a publicly available analytical tool InvestSpy utilizing historical data for the last 2 years.
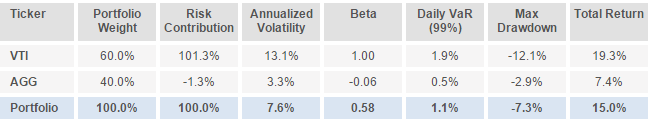
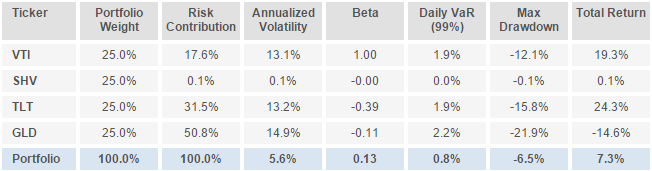
60/40
A "classical" portfolio consisting of 60% stocks and 40% bonds. Often considered as a simple benchmark for a balanced asset allocation and tends to be difficult to outperform over long time periods.
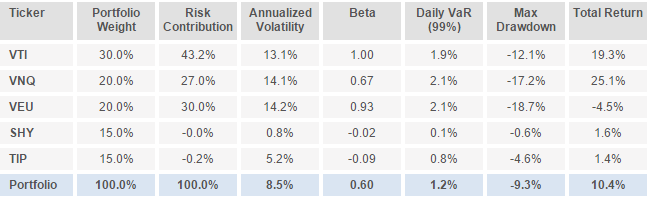
Swensen Portfolio
David Swensen has been the Chief Investment Officer at Yale University since 1985, where he is responsible for managing the university's endowment fund and has a spectacular track record. This portfolio consists of 70% equities and 30% fixed income, split between several sub-classes.
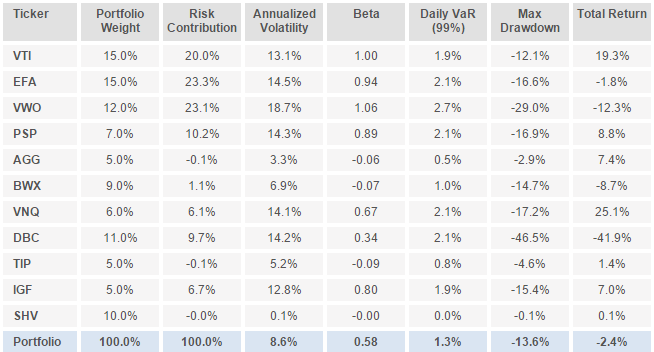
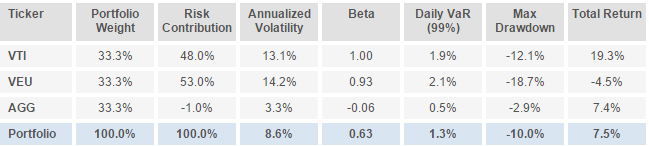
El-Erian Portfolio
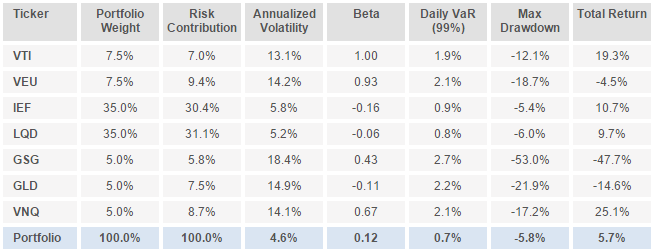
This portfolio is modelled on an allocation suggested in El-Erian's book When Markets Collide and managed to outperform equities only portfolio over the last 40+ years. It is
More aggressive than some others, this had 51 per cent in various classes of stocks, 17 per cent in bonds, and the remainder distributed between index-linked bonds, commodities and real estate. This portfolio is 60% invested in various sub-classes of equities, 29% in fixed income and 11% in commodities.
Arnott Portfolio
Rob Arnott is the founder and chairman of Research Affiliates and a portfolio manager at PIMCO. Bg proponent of fundamental indexing and smart beta, he has once suggested that the "ultimate" portfolio should consist of equal parts in a range of sub-asset classes. They add up to 30% equities, 60% fixed income and 10% commodities.
Permanent Portfolio
Created by the late Harry Browne in the 1980s, the Permanent Portfolio divides holdings into four equal pieces of stocks, long-term U.S. treasuries, cash, and gold. Simple as it looks, the Permanent Portfolio had only 3 down years over the last 30 years!
Andrew Tobias Portfolio
Andrew Tobias is a well-known author who proposes a "lazy" portfolio with only three equally sized holdings: US stocks, international stocks and US bonds.
William Bernstein Portfolio
William Bernstein is an investment advisor and best-selling author with a strong focus on efficient asset allocation. The portfolio below tries to replicate his suggestion in the book The Intelligent Asset Allocator. 75% are invested in stocks and the remainder in fixed income.
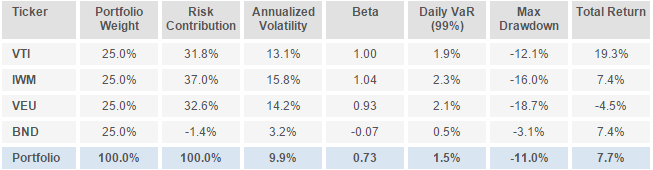
Ivy Portfolio
The Ivy Portfolio has been proposed by Meb Faber, who is a co-founder and the chief investment officer of Cambria Investment Management as well as a popular author. His proposed portfolio consists of equally weighted 5 components: bonds, US stocks, international stocks, real estate and commodities. This effectively equates to 60% stocks, 20% bonds and 20% commodities.
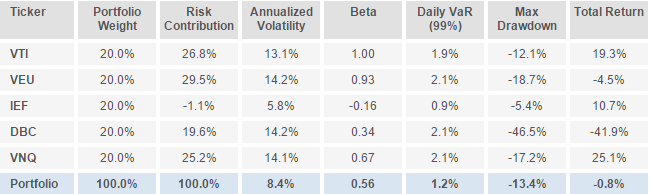
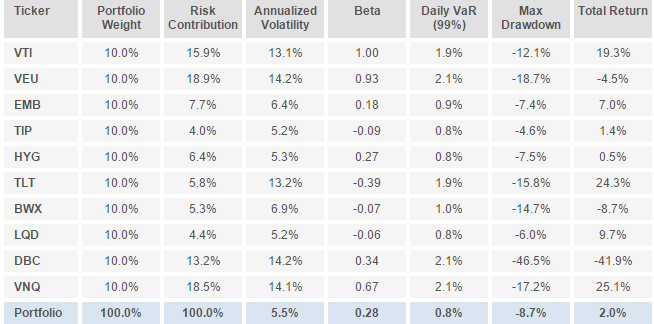
Risk Parity Portfolio
Risk parity is an approach to investment portfolio management which focuses on allocation of risk, usually defined as volatility, rather than allocation of capital. There are countless versions of implementation and this particular one has 20% invested in equities, 70% in fixed income and 10% in commodities.
Conclusion
Analysing the tables above, there are a few interesting observations:
- The best performer in terms of absolute returns was the simplest portfolio - 60/40, which gained 15.0% over the last two years. Swensen portfolio was second with a 10.4% return. The superior performance of these two portfolios was largely due to their substantial allocations to US equities as well as limited or non-existent exposures to commodities and emerging markets.
- The only two portfolios to post a negative return in the specified period were El-Erian (-2.4%) and Ivy (-0.8%). Both of these portfolios suffered badly from underperformance of commodities and turbulence in emerging markets.
- All 9 portfolios experienced a massive decline in annualized volatility, which in most cases more than halved. This comes as no big surprise though as the reference period covered August 2008 - August 2013 that included the peak of the financial crisis.
- Finally, and probably most importantly, risk contributions in portfolios remained very close to the levels seen two years ago, with the only exception being the Risk Parity portfolio. This is a great illustration that even though portfolio returns are volatile, the risk sources tend to be stable. And it is a good reason why analysis of risk metrics should always be a part of the investment decision making process.