I examine the 90-year history (1926-2015) of risk and return for stocks (S&P 500), bonds (Citigroup high grade), T-bills and inflation. What are reasonable expectations for getting rewarded for risk? What has inflation taken away? What other lessons can be learned? Understanding the past can help us deal with the future.
Reward for Taking Risk
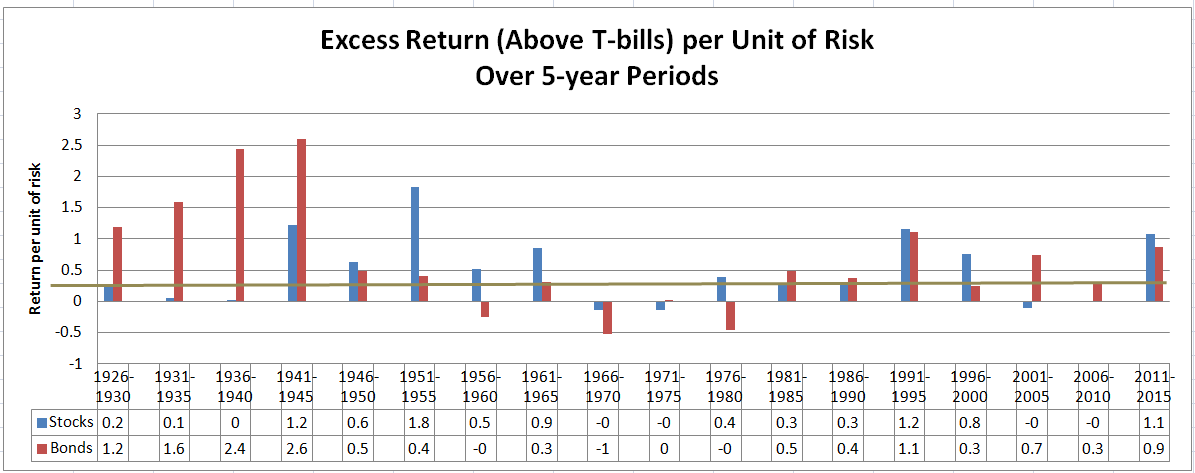
The following table shows the history of reward, defined as average annual return above T-bills, per unit of risk, defined as the annualized standard deviation of monthly returns. As you can see, .34% is the average reward (solid line) and 1% would be high, except for bonds in the 1930s and 1940s.
The average standard deviation of stock returns over the full 90-year history has been 18.85% and the average excess return per unit of risk is .34, so total excess return should be approximately 18.85 X .34% = 6.4%. The actual excess return is 10.02%-3.46% = 6.6%.
Inflation
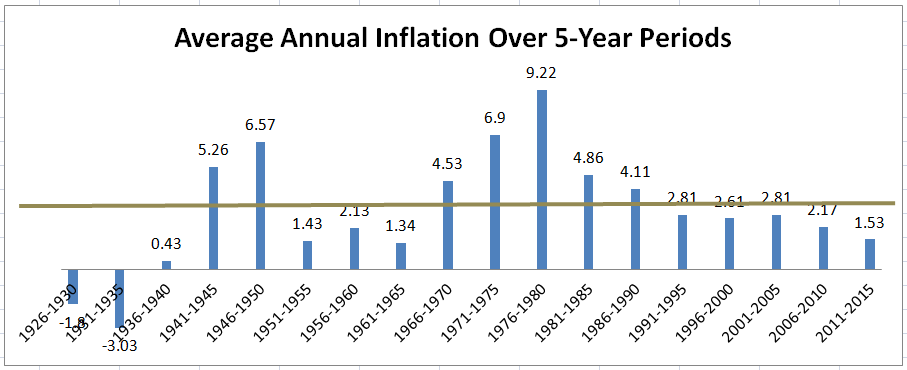
The following table shows average annual changes in the CPI over 5-year periods. Inflation has averaged 3% per year over the full 90-year history. We saw deflation in 1926-1935 during the Great Depression. The highest 5-year period was 1976-1980, during which inflation averaged 9.22%. The U.S. experience with inflation has been subdued relative to some other countries with a history of hyperinflation.
Other Observations
The table has many lessons, so it's worth your time and effort to review these results. For example, here are a few of the lessons:
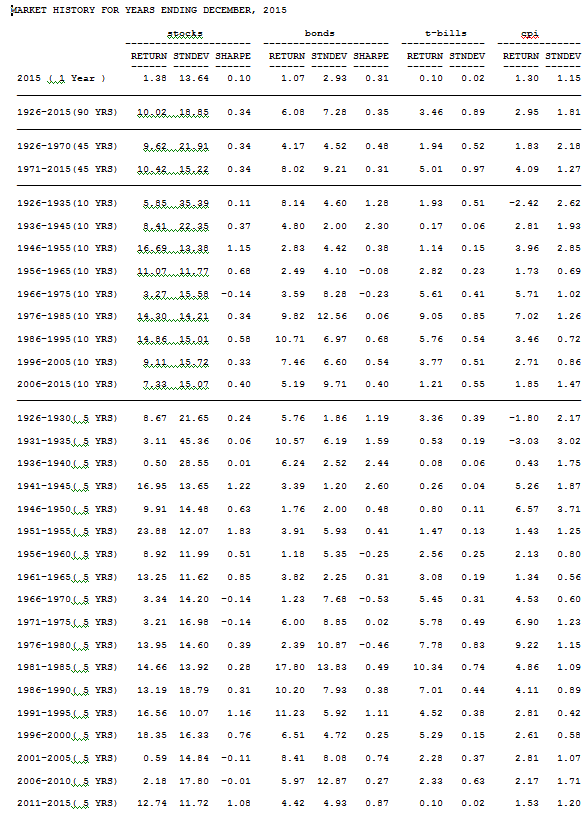
- T-bills paid less than inflation in 2015, earning 0.1% in a 1.3% inflationary environment. We paid the government to use their mattress, as we have for the past ten years, with a 1.21% return in a 1.85% inflationary environment.
- Bonds were more "efficient," delivering more returns per unit of risk than stocks in the first 45 years, but they have been about as efficient in the most recent 45 years. The Sharpe ratio for bonds is .48 versus .34 for stocks in the first 45 years, but the Sharpe ratio for both is about the same in the more recent 45 years. Both stocks and bonds have returned about .32% per unit of risk.
- Average inflation in the past 45 years has been more than twice that of the previous 45 years: 1.83% in 1926-1970 versus 4.09% in 1971-2015.
- Bonds returned 2% above inflation in the first 45 years, and that doubled to above 4% in the past 45 years.
- Stock market volatility was much higher in the 20-year period 1926-1945 than it has been since. Volatility subsided from 20-35% down to 15% in the most recent 70 years.
- By contrast, bond markets have become more volatile, more than doubling in the most recent 45 years to 9.23%, versus 4.52% in the first 45 years.
Source: PPCA Inc.
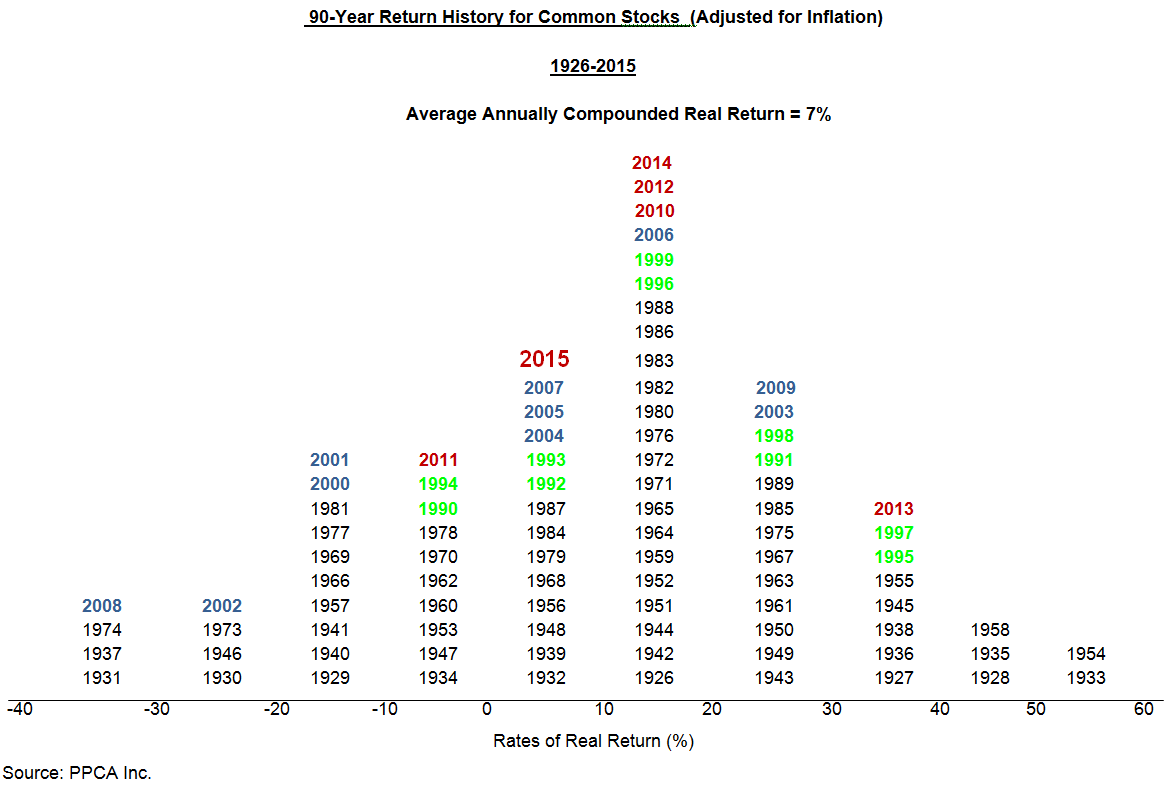
Histograms
Additional perspective is provided by the following histograms of stock and bond returns.