February Technology SML Dogs
Yield (dividend / price) results from here verified by Yahoo Finance were calculated as of February 16, 2016 for Small, Mid, & Large cap Technology stocks. Small cap firms were valued at $200M(illion) to $2B(illion); Mid cap firms were worth $2B to $10B; Large caps were valued above $10B. Those yield results led to three actionable conclusions discussed below.
Fifty For the Money
Since late 2011 this report series has applied dog dividend methodology to uncover possible buy opportunities in each of eight major market sectors listed by Yahoo Finance: basic materials (BasMats), consumer goods (ConGo), financials (Fins), healthcare (Heal), industrial goods (IndiGo), services (Svcs), technology (Tec), and utilities (Utes). In the past two years the series expanded to report (1) dividend yield; (2) price upside; (3) net gain results based on analyst 1 yr. target projections.
This article was intended to reveal bargain stocks to buy and hold up to one year. See Dow 30 article for explanation of the term "dogs" for stocks reported based on Michael B. O'Higgins' book "Beating The Dow" (HarperCollins, 1991), now named Dogs of the Dow. O'Higgins system works to find bargains in any collection of dividend paying stocks. Utilizing analyst price upside estimates expanded the stock universe to include popular growth equities, as desired.
Dog Metrics Sourced Technology Stocks by Yield
Actionable Conclusion (1): Telecommunication Firms Still Leading Tech Sector Yields
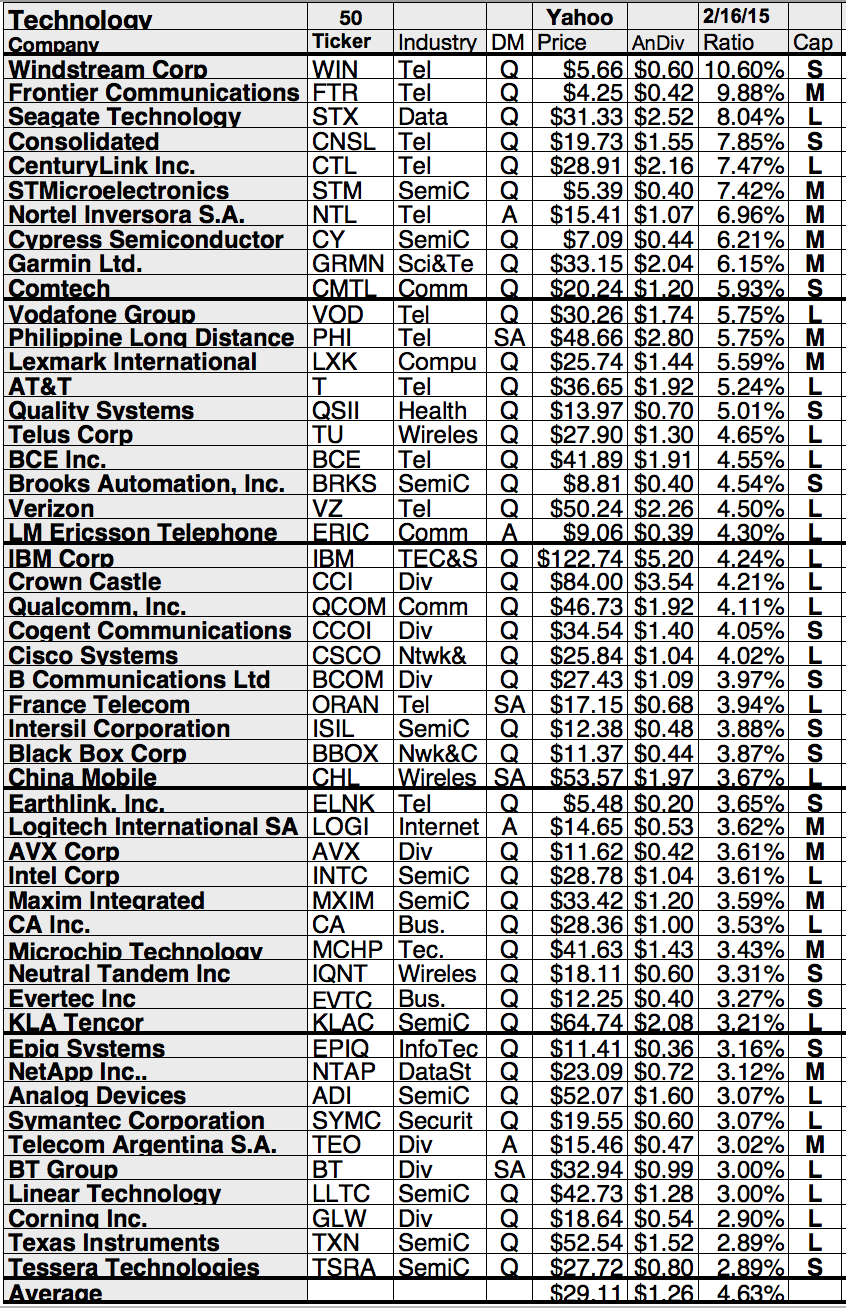
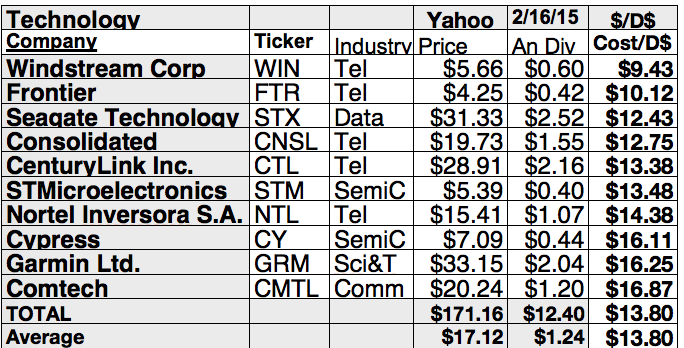
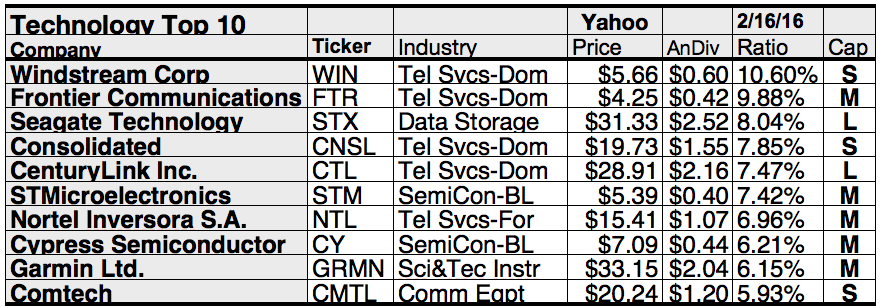
Ten stocks that showed the biggest dividend yields after January, per Yahoo! Finance data, represented six technology sector industries: telecom services domestic; data storage; semiconductor-broad line; telecom services foreign; scientific & technical instruments; communication equipment.
Tops by yield were two of four telecom service-domestic firms: Windstream Corp. (NASDAQ:WIN) [1], and Frontier Communications (NASDAQ:FTR) [2]. The other domestic telecom placed fourth and fifth, Consolidated Communications Holdings (NASDAQ:CNSL) [4], and CenturyLink Inc. (NYSE:CTL) [5].
In third place was the lone Data Storage representative, Seagate Technology (NASDAQ:STX) [3]. Two semiconductor-broad line firms placed sixth and eighth: STMicroelectronics NV (NYSE:STM) [6], and Cypress Semiconductor (NASDAQ:CY) [8].
The lone telecom service foreign firm placed seventh, Nortel Inversora S.A. (NYSE:NTL) [7]. Finally, Garmin Ltd. (NASDAQ:GRMN) [9], made the list for scientific & technical instruments and Comtech Telecommunications (NASDAQ:CMTL) [10] represented the communication equipment industry and completed the February technology top ten dog list by yield.
Technology Sector Dividend vs. Price Results Were Opposed to The Dogs of the Dow
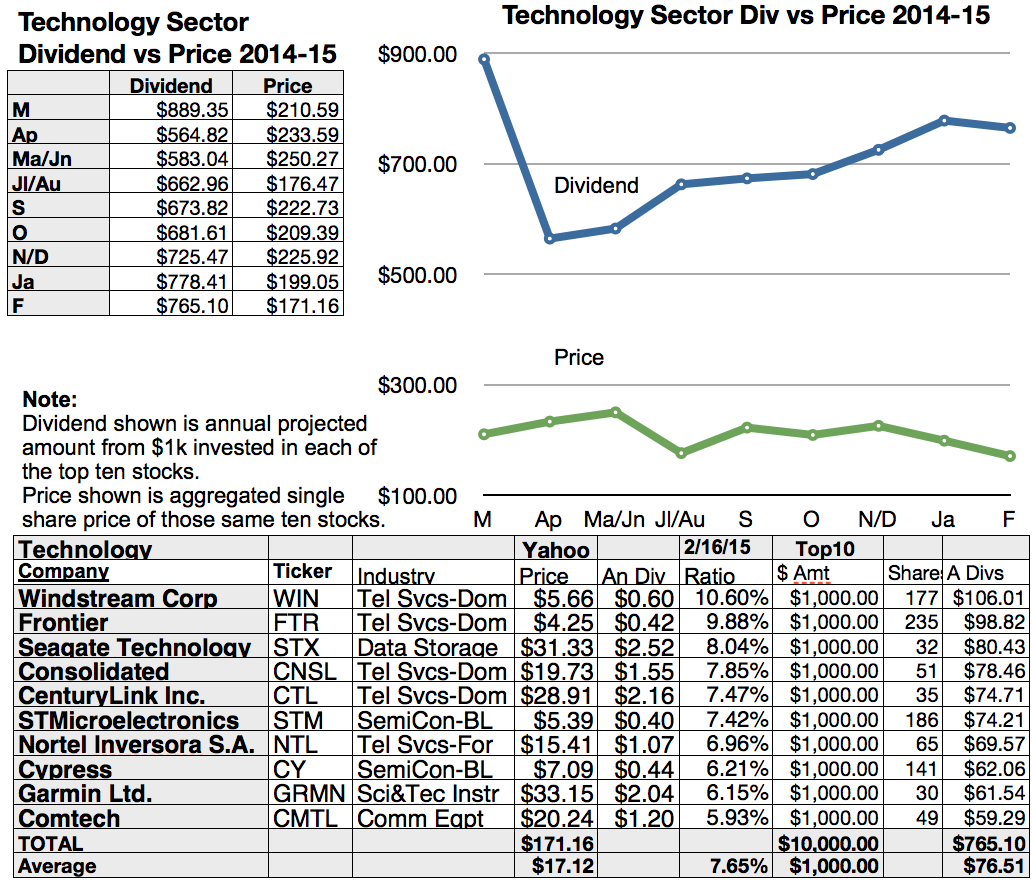
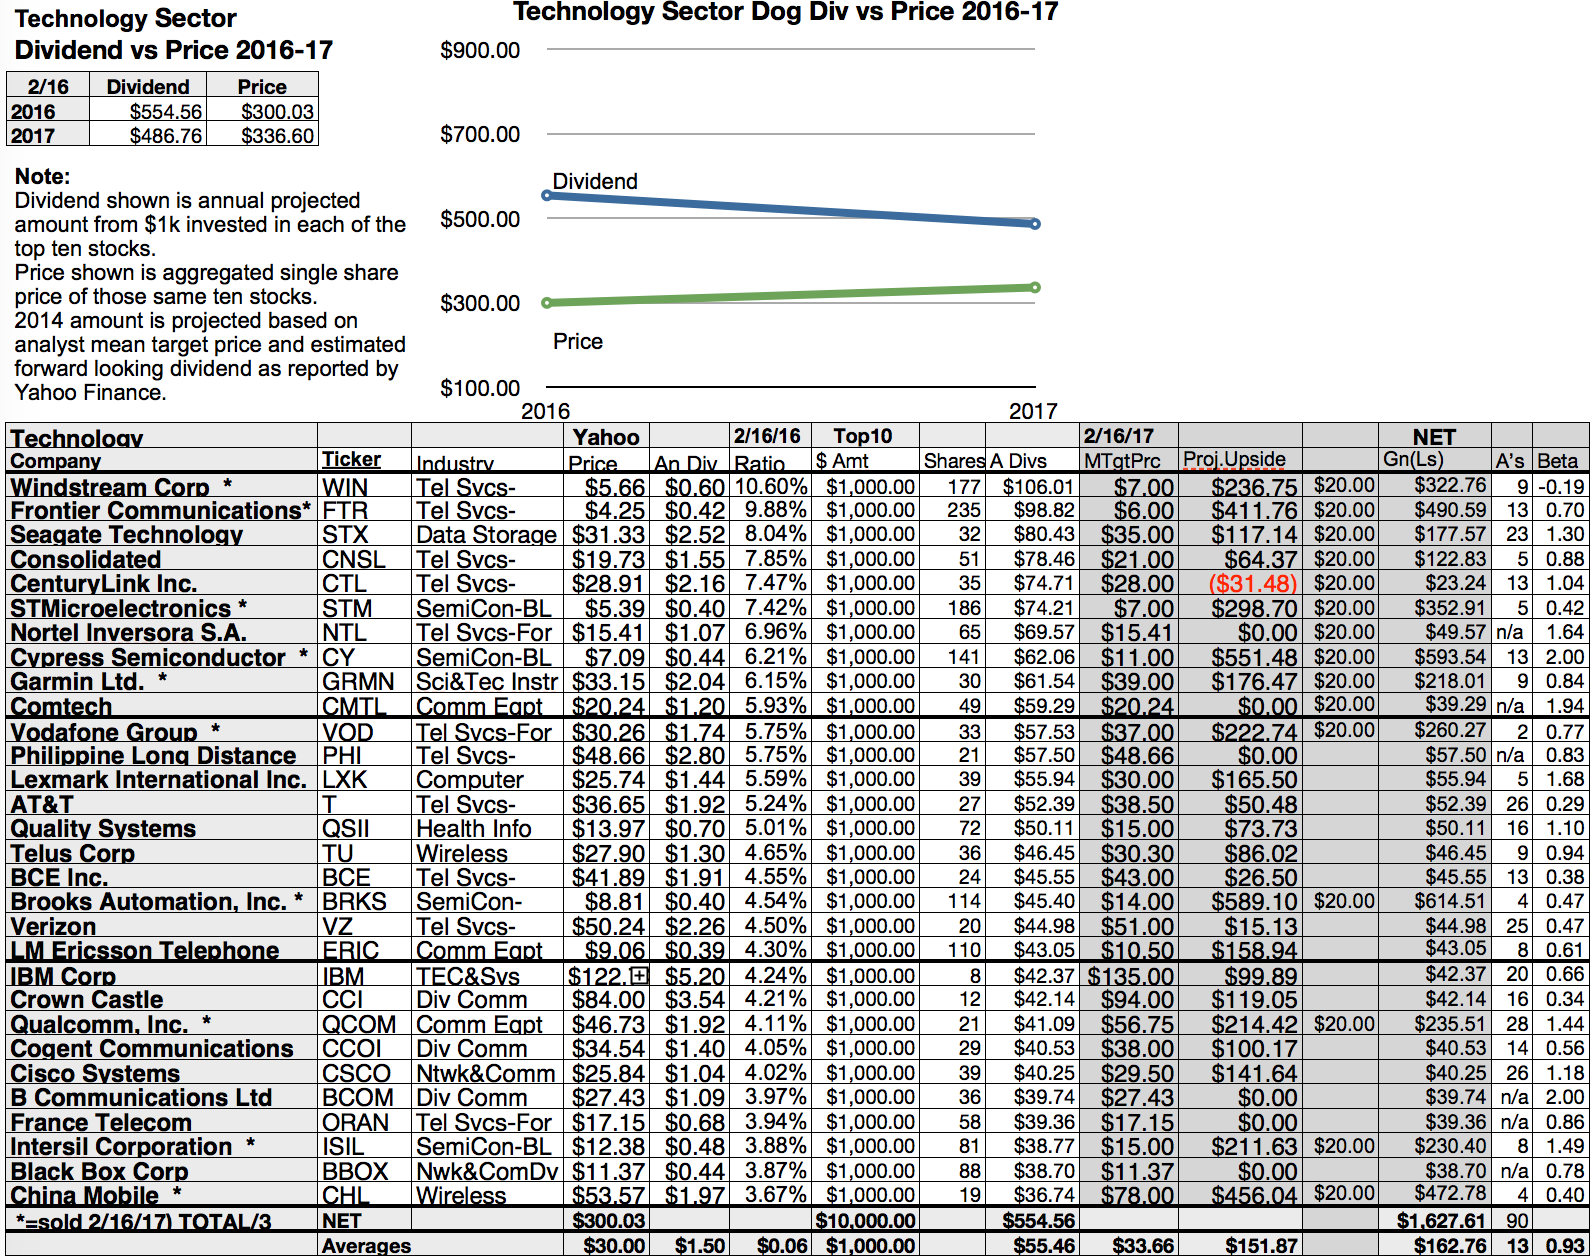
Relative strengths of the top ten technology dogs graphed below by yield 2/16/2016 were compared to those of the Dow. Projected annual dividend history from $10,000 invested as $1k in each of the ten highest yielding stocks and the total single share prices of those ten stocks created the data points shown in green for price and blue for dividends.
Actionable Conclusions: (2) Technology Dogs Retreated As (3) Dow Dogs Mixed It Up
As of February 16, dividend from $10k invested as $1k in each of the top ten technology stocks dropped as aggregate single share price of those ten also tumbled. Price dropped 14% while dividend fell 1.7% to mix down.
Dow dogs mixed up after January. Projected annual dividend from $10k invested as $1K in each of the top ten rose 3.86%. At the same time, aggregate single share price increased 5% to confirm the mix up.
The Dow dogs overbought condition (in which aggregate single share price of the ten exceeded projected annual dividend from $1k invested in each of the ten) expanded.
[I invite you to sign on to my premium site, The Dividend Dog Catcher, to share my discussion about how the Dow (short of tossing out IBM) could in one move return to a normal balance where dividends from 10 $1k investments can again exceed the aggregate single share price of those top ten stocks.]
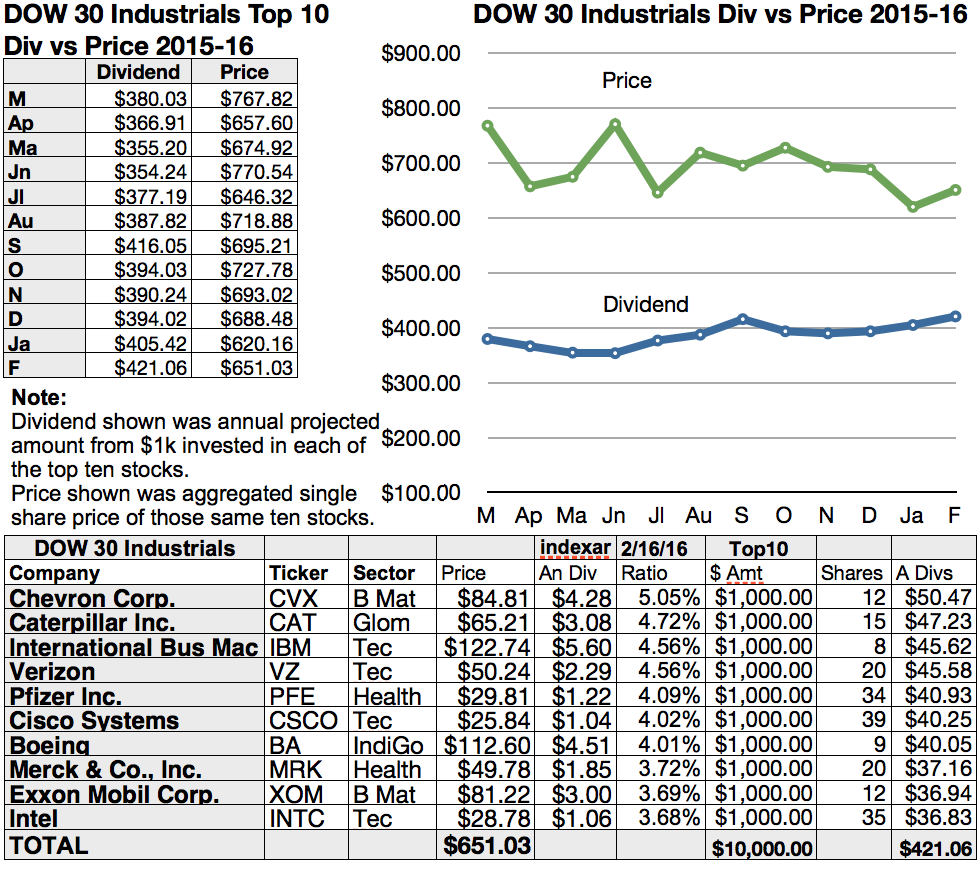
Actionable Conclusion (4): Dow Dogs Continue To Be Overbought
The overhang was $388 or 102% in March; shrank back to $291 or 79% for April; widened to $320 or 90% to begin May; soared to the new record $406 or 112% in June.
The Dow bubble deflated as Dupont replaced IBM in the ten slot of the top ten for July to peg the gap at $269 or 71%, then inflated again as IBM replaced Pfizer to widen the gap to $331 or 85% for August. September brought some sanity back to the runaway Dow when the gap stood at $279 or 67%. October increases in price by CVX and XOM pushed the gap to $334 or 85%.
November changed out MCD for WMT, and GE for KO. The resulting price over dividend gap went to $303 or 78%. As of December 4 the gap stood at $294 or 75%. Come January 12, prices of the ten Dow top dogs fell, and dividends rose, as Boeing replaced General Electric to reduce the overbought gap to $215 or 53%. February moves put the gap at $230 or 55% February 16.
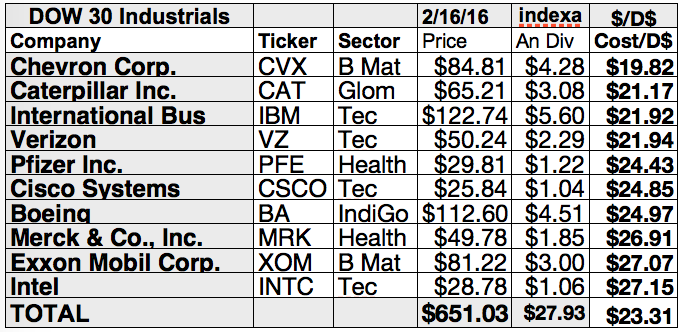
This gap between high share price and low dividend per $1k invested defines the Dow over-bought condition. Meaning these are low risk and low opportunity Dow dog stocks. The Dow top ten average price per dollar of annual dividend is $23.75.
In contrast to the Dow, technology dog charts show them to be higher risk but also higher gain potential pups than those of the Dow. The Technology top ten average price per dollar of annual dividend is $13.80.
Wall Street Wizard Works
One-year mean target price set by brokerage analysts multiplied by the number of shares in a $1k investment revealed ten stocks showing the highest upside price potential into 2017 out of 30 selected by yield. The number of analysts providing price estimates was noted after the name for each stock. Three to nine analysts have usually provided the most accurate mean target price estimates.
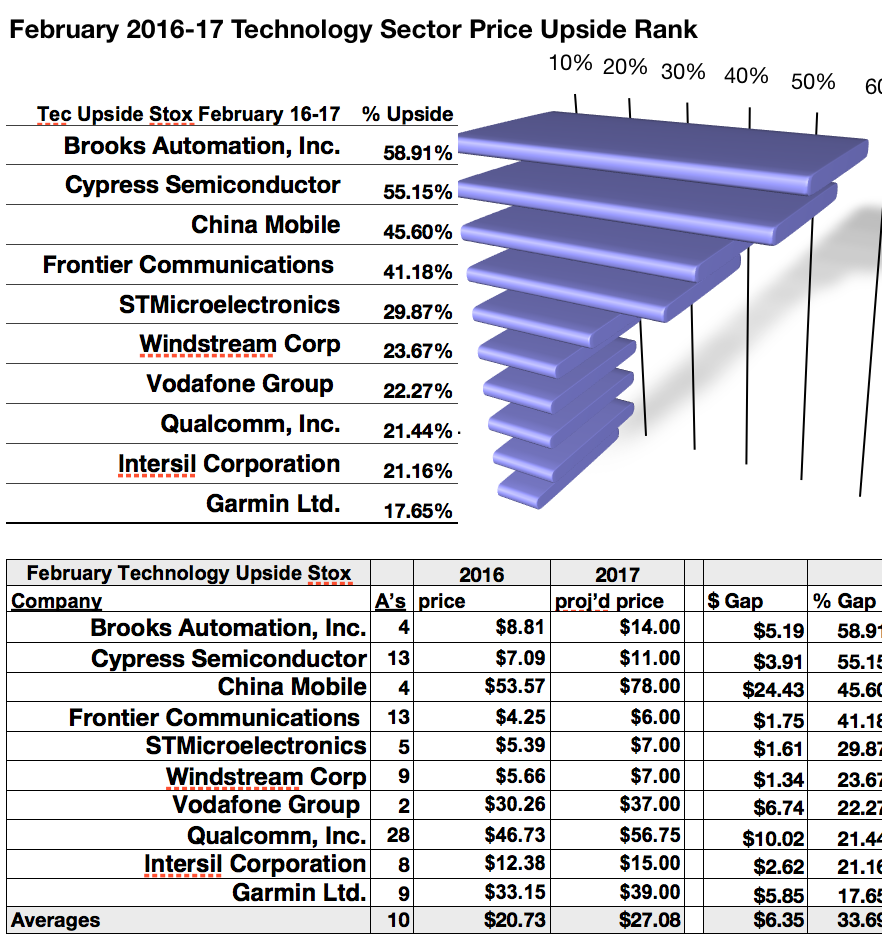
Actionable Conclusion: (5) Analysts Allege 33.69% Average Price Upsides For Ten Technology Dogs Come February 2017
To quantify top dog rankings, analyst mean price target estimates provide a "market sentiment" gauge of upside potential. Added to the simple high yield "dog" metrics, analyst mean price target estimates provided another tool to dig out bargains.
Actionable Conclusions: Wall St. Wizards Cast (6) A 15.19% Average Upside; (7) A 16.28% Average 1 yr. Net Gain from Top 30 February Technology Dogs
Tech sector dogs were graphed below to show relative strengths by dividend and price as of February 16, 2016 and those projected by analyst mean price target estimates to the same date in 2017.
A hypothetical $1000 investment in each equity was divided by the current share price to find the number of shares purchased. The shares number was then multiplied by projected annual per share dividend amounts to find the dividend return. Thereafter the analyst median target price was used to gauge the stock upside to 2017.
Historical prices and actual dividends paid from $1000 invested in each of the thirty highest yielding stocks and the aggregate single share prices of those thirty stocks divided by 3 created the data points for 2016. Projections based on estimated increases in dividend amounts from $1000 invested in the thirty highest yielding stocks and aggregate one year analyst target share prices from Yahoo Finance divided by 3 created the 2017 data points green for price and blue for dividends.
Analysts reported by Yahoo finance projected a 12.2% lower dividend from $10K invested in this group while aggregate single share price was projected to increase by 12.19% in the coming year. The number of analysts contributing to the mean target price estimate for each stock was noted in the next to the last column on the charts. Three to nine analysts have proven to provide more accurate projected estimates. Estimates provided by one analyst were not applied (n/a).
A beta (risk) ranking for each stock was shown in the far right column on the above chart. A beta of 1 meant the stock's price would move with the market. Less than 1 showed lower than market movement. Higher than 1 showed greater than market movement. A negative beta number indicated the degree of a stock price movement opposite market direction.
Actionable Conclusion (8): Wall St. Wizards Estimate 10 Technology Dogs To Net 21.8% to 61.45% Gains by February 2017
Five of the ten top dividend yielding technology dogs were verified as being among the ten top net gainers for the coming year based on analyst 1 year target prices. So this period the dog strategy for technology stocks as graded by Wall St. wizards was 50% accurate.
Ten probable profit generating trades were revealed by Thomson/First Call in Yahoo Finance for February 2017:
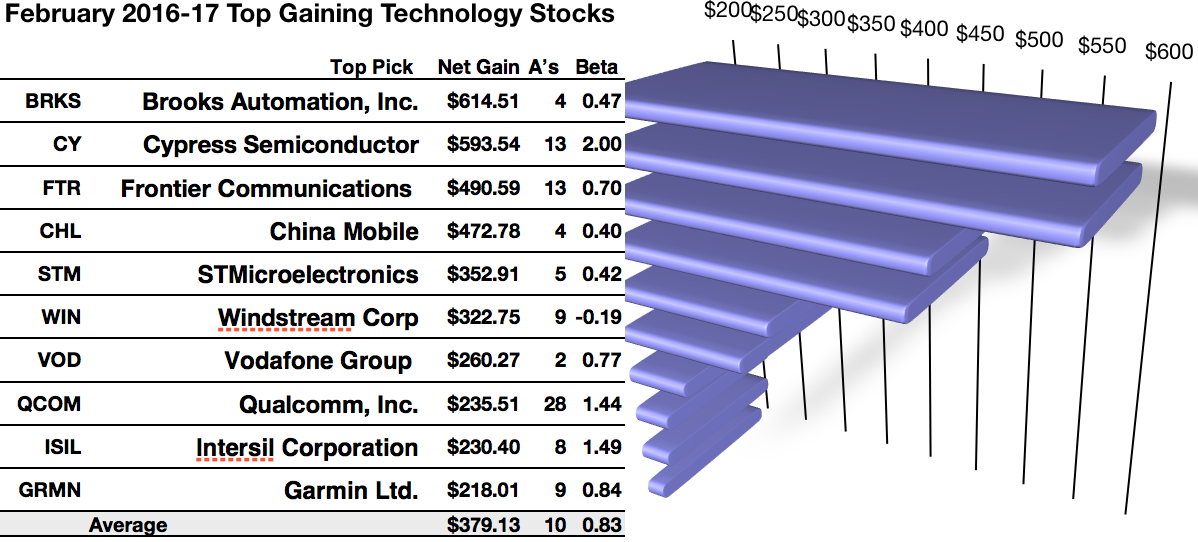
Brooks Automation, Inc. (NASDAQ:BRKS) was projected to net $614.51 based on dividends plus a median target price estimate by four analysts less broker fees. The Beta number showed this estimate subject to volatility 53% less than the market as a whole.
Cypress Semiconductor was projected to net $593.54, based on dividends plus a mean target price estimate from thirteen analysts less broker fees. The Beta number showed this estimate was subject to volatility 100% more than the market as a whole.
Frontier Communications was projected to net $490.59 based on estimates from thirteen analysts plus dividends less broker fees. The Beta number showed this estimate subject to volatility 30% less than the market as a whole.
China Mobile (NYSE:CHL) was projected to net $472.78 based on the median target price estimate from four analysts combined with projected annual dividend less broker fees. The Beta number showed this estimate subject to volatility 60% less than the market as a whole.
STMicroelectronics was projected to net $352.91 based on estimates from five analysts plus dividends less broker fees. The Beta number showed this estimate subject to volatility 58% less than the market as a whole.
Windstream Corp was projected to net $322.75, based on dividends plus a median target price estimate from nine analysts less broker fees. The Beta number showed this estimate subject to volatility 19% opposite the market as a whole.
Vodafone Group (NASDAQ:VOD) was projected to net $260.27, based on dividends plus a median target price estimate from two analysts less broker fees. The Beta number showed this estimate was subject to volatility 23% less than the market as a whole.
Qualcomm, Inc. (NASDAQ:QCOM) was projected to net $235.51 based on estimates from twenty-eight analysts plus dividends less broker fees. The Beta number showed this estimate subject to volatility 44% more than the market as a whole.
Intersil Corporation (NASDAQ:ISIL) was projected to net $230.40 based on dividends plus the median of annual price estimates from eight analysts less broker fees. The Beta number showed this estimate subject to volatility 49% more than the market as a whole.
Garmin Ltd. was projected to net $218.01 based on estimated dividends plus median target price estimate from nine analysts less broker fees. The Beta number showed this estimate subject to volatility 16% less than the market as a whole.
Average net gain in dividend and price was 37.91% on $10k invested as $1k in each of these ten dogs. This gain estimate was subject to average volatility 17% less than the market as a whole.
Dog Metrics Extracted More Bargains From Five Lowest Priced Highest Yield Technology Stocks
Ten monthly pay stock equities were culled by yield from here. Yield (dividend / price) results verified by Yahoo Finance did the ranking.
As noted above, ten stocks that showed the biggest dividend yields after January, per Yahoo! Finance data, represented six technology sector industries: telecom services domestic; data storage; semiconductor-broad line; telecom services foreign; scientific & technical instruments; communication equipment.
Actionable Conclusions: (9) Analysts Assert 5 Lowest Priced of Ten Highest Yield Technology Dividend Dogs Deliver 36.19% VS. (10) 23.9% Net Gains by All Ten as of February 16, 2017
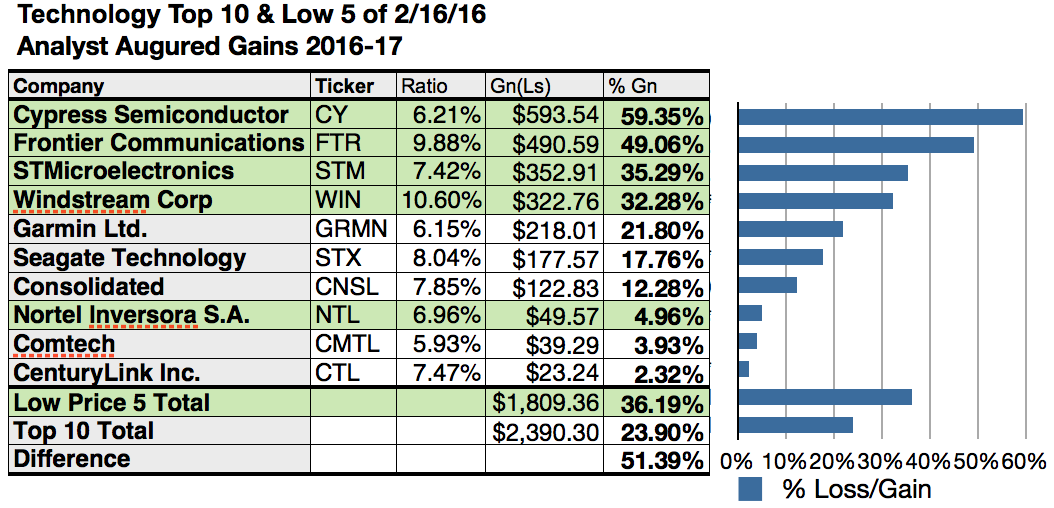
$5000 invested as $1k in each of the five Lowest priced stocks in the top ten technological dividend kennel by yield were predicted by analyst 1 year targets to deliver 51.39% more net gain than $5,000 invested as $.5k in each of all ten. The fourth lowest priced, Cypress Semiconductor , was projected to deliver the best net gain of 59.35%.
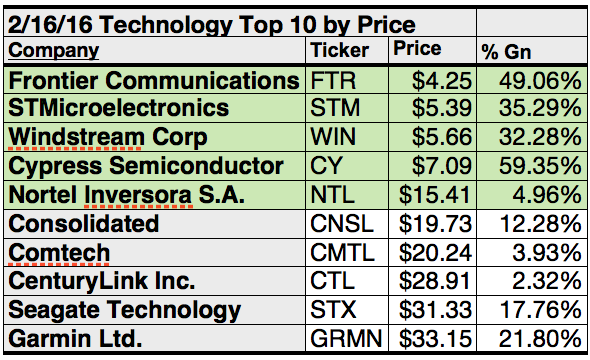
Lowest priced five technology dividend dogs for February 16 were: Frontier Communications; STMicroelectronics; Windstream Corp; Cypress Semiconductor; Nortel Inversora S.A., with prices ranging from $4.25 to $15.41.
Higher priced five Technological dividend dogs for February 16 were: Consolidated Communications Holdings; Comtech Telecommunications; CenturyLink Inc.; Seagate Technology; Garmin Ltd., whose prices ranged from $19.73 to $33.15.
This distinction between five low priced dividend dogs and the general field of ten reflects the "basic method" Michael B. O'Higgins employed for beating the Dow. The same technique, you now see, can also be used to find the more rewarding dogs in the Financial sector.
The added scale of projected gains based on analyst targets contributed a unique element of "market sentiment" gauging upside potential. It provided a here and now equivalent of waiting a year to find out what might happen in the market. Its also the work analysts got paid big bucks to do.
A caution is advised, however, as analysts are historically 20% to 80% accurate on the direction of change and about 0% to 20% accurate on the degree of the change.
Net gain and loss estimates above did not factor-in any foreign or domestic tax problems resulting from distributions. Consult your tax advisor regarding the source and consequences of "dividends" from any investment.
See my instablog for specific instructions about how to best use the dividend dog data featured in this article. --Fredrik Arnold
Stocks listed above were suggested only as possible starting points for your Technology dog dividend stock purchase/sale research process. These were not recommendations.
Do any of these technology sector dividend pups qualify as valuable catches? Check out the now 26 Dogs of the Week found on The Dividend Dog Catcher premium site. Click here to subscribe.
One click will answer all your questions about price and guarantees. Sign up. It's no risk. If for any reason you choose to end your subscription, you'll get a prorated refund from Seeking Alpha.
Perhaps the Seeking Alpha Marketplace is the best financial advisory bargain on the internet.
Disclaimer: This article is for informational and educational purposes only and should not be construed to constitute investment advice. Nothing contained herein shall constitute a solicitation, recommendation or endorsement to buy or sell any security. Prices and returns on equities in this article except as noted are listed without consideration of fees, commissions, taxes, penalties, or interest payable due to purchasing, holding, or selling same.
Graphs and charts were compiled by Rydlun & Co., LLC from data derived from www.indexarb.com; www.dividend.com; finance.yahoo.com; analyst mean target price by Thomson/First Call in Yahoo Finance.