On Thursday, I talked a bit about cow leasebacks in China.
That sounds funny because it is funny.
You can read the whole piece for a good laugh, but one thing that is evident from Bloomberg's coverage of the story is that Yang Kai, Chairman of China Huishan Dairy Holdings Co., is pretty clearly selling cows and renting them back to sustain both, i) his capacity to produce product, and more importantly, ii) the buybacks that helped his company avoid the malaise that beset Chinese equities last summer.
One commenter (and yes, I do read comments occasionally) noted that buybacks have likewise contributed to the rally in US equities that's driven the S&P (NYSEARCA:NYSEARCA:SPY) to record levels off the 2009 lows at various times over the course of what's been a years-long sustained rally.
That is almost undoubtedly correct and trust me, I know the narrative very well. I recounted it just this week. Here's how I put it:
Investors are hurting for yield thanks to seven years of unconventional monetary policy and that's driven demand for corporate credit, both IG and HY. Companies have taken advantage of a kind of goldilocks situation for corporate debt issuance that pairs strong demand with rock bottom borrowing costs.
Companies, the narrative goes, use the proceeds from debt sales to buy back shares, inflating equity-linked compensation for corporate management teams and, more importantly, artificially boosting the bottom line. It's financial engineering at its finest; leveraging the balance sheet to manage the optics around earnings and keep the stock price afloat.
More simply, from a corporate management perspective: "Investors want yield, the market wants EPS beats, so let's issue corporate debt at yields that look great to investors compared to safe haven govies but which are incredibly attractive to us and use the proceeds to reduce the share count and thus boost the bottom line."
It isn't complicated.
But it is myopic.
I encourage you to read the above cited piece, but I will hit the high points here.
First, here are the facts on buybacks courtesy of Deutsche Bank:
S&P spent $485bn or 2.7% of market cap on net buybacks in the 4 quarters through 1Q16. This contributed 2.2% to S&P EPS growth. Share count shrink is normally smaller than the net dollar spent on buybacks as % of S&P market cap because companies repurchase shares at market prices but issue them at lower prices through stock option programs. We expect S&P companies to spend similar $450bn net dollars on buybacks in 2016 contributing ~1.5% to S&P EPS growth.
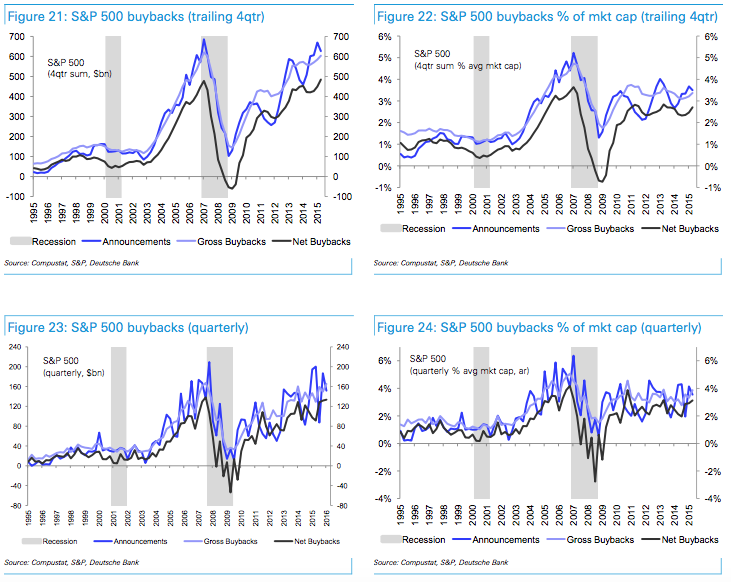
(Charts: Deutsche Bank)
But here's something else to consider, again from DB:
S&P non-GAAP net margin reached an all time high of 10.7% in 2Q-3Q 2015 and was 10.5% in full 2015. Net margin declined to 10.3% in 4Q15 and further to 10.0% in 1Q16. But net margins ex Energy & Financials held up very well: 10.0% in 1Q16 vs. 10.1% in 1Q15.
I bring up the margin numbers because as I've mentioned before, there's some disagreement as to whether EPS strength is the result of buybacks or margins.
FactSet is inclined to go with the latter, for whatever that's worth. This is probably quantifiable (and in the linked FactSet piece there are some numbers), but that's beyond the scope of this piece.
What I want to emphasize is the following chart from BofAML. I'm going to close with it and a brief excerpt from the bank and leave it to readers to draw their own conclusions about what it means for equity strength going forward:
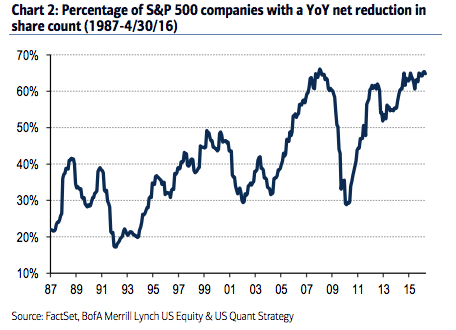
(Chart: BofAML)
Corporates have been propping up EPS growth via a near-record proportion of buybacks. 65% of companies in the S&P 500 have taken out share count vs. the previous year, the highest since when the market peaked in late 2007.