 This is the 9th article in the series of attempting to assemble a $100,000 CEF/ETF portfolio that generates 7% annually in cash returns and at the same time maintains one's capital. This is the type of portfolio a retiree desires to maintain income, someone like myself. Because most retirees don't want to spend much time on investments, but rather on an enjoyable lifestyle, this portfolio is looking to CEFs and ETFs that have a history of generating this income with little input from the investor. CEFs and ETFs are not created equal and some perform much better than others. Therefore this series of articles back tests many sector funds for 5 years in order to find a well-founded selection for a strong, diversified portfolio. One can view the conclusions from the first 8 articles here.
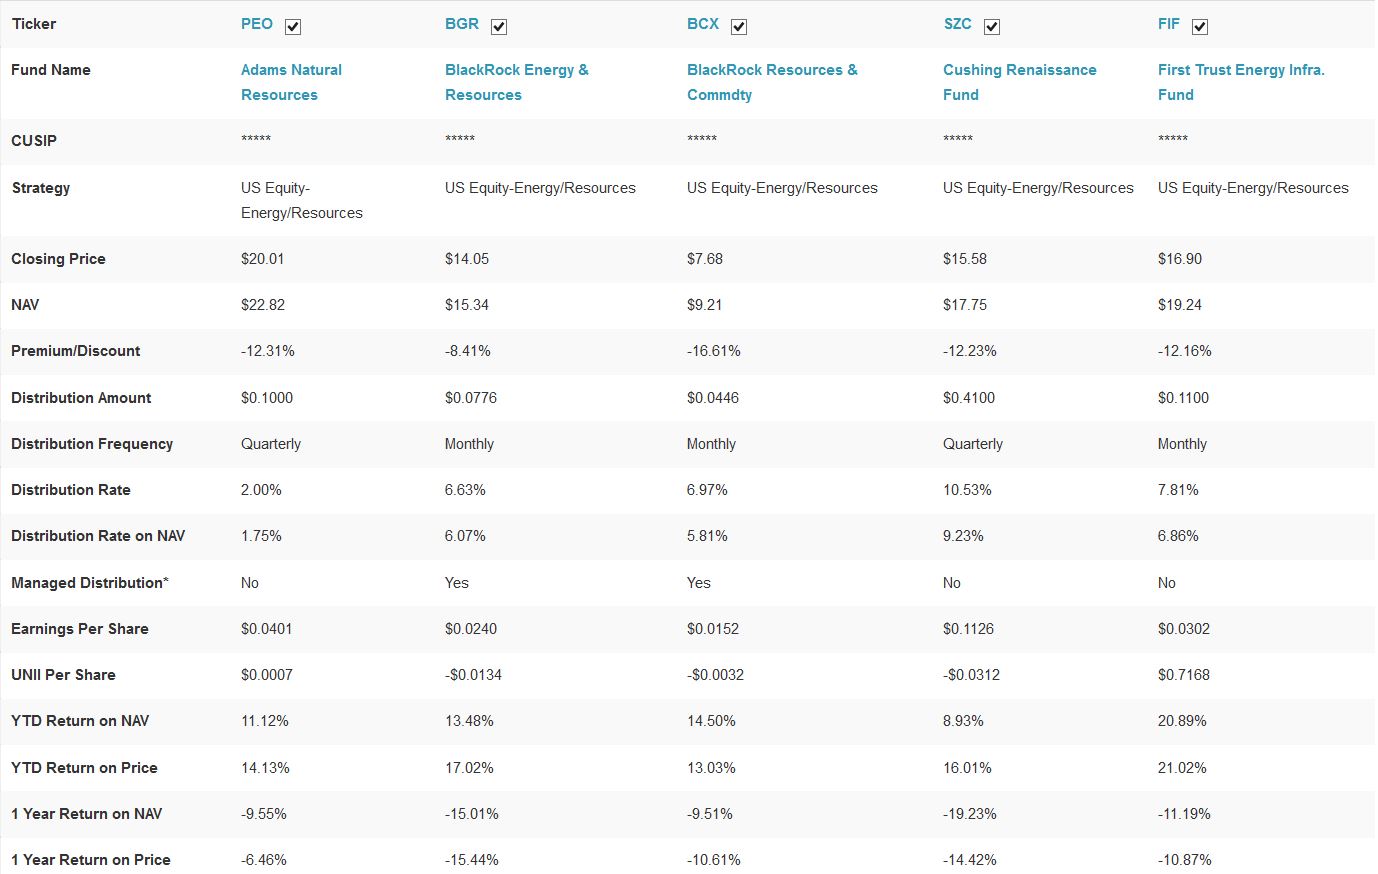
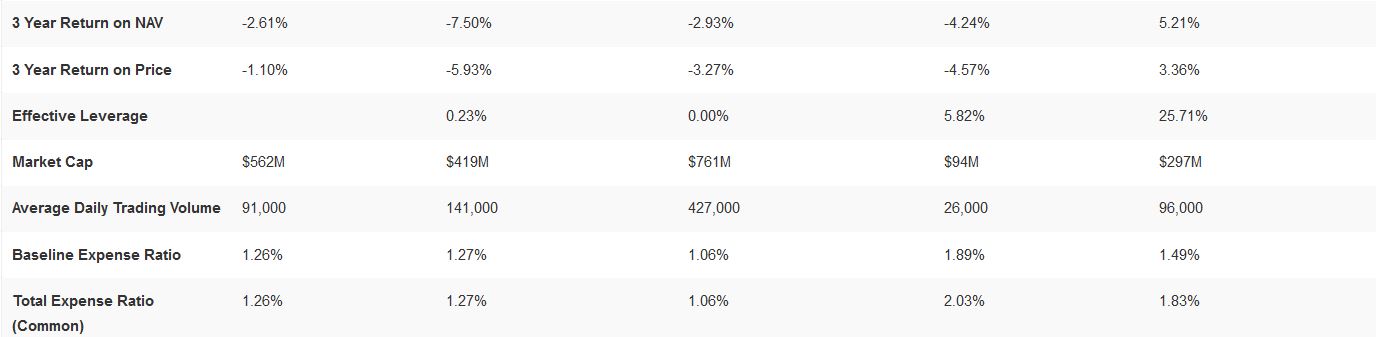
This article is directed toward finding an energy fund that will provide a 7% cash return for this portfolio. To start I screened energy CEFs at CEF Connect and the table below shows the results of this search. Only those with the lowest expense ratios were examined, they were the Adams Natural Resources Fund, Inc. (PEO), the BlackRock Energy and Resources Trust (BGR), the Blackrock Resources & Commodities Strategy Trust (BCX), the Cushing Renaissance Fund (SZC), and the First Trust Energy Infrastructure Fund (NYSE:FIF).
Source: CEF Connect Web Site
The results of these 5 CEFs were placed in TD Ameritrade's compare funds table which is displayed below.


Source: TD Ameritrade Web Site
The sector breakdown above indicates there are huge differences between these 5 CEFs. Some of the CEFs have only 50% or less in oil issues, while on the other hand there is one CEF that is 100% invested in energy. Looking further down the table, the stocks each CEF holds are quite different as well.
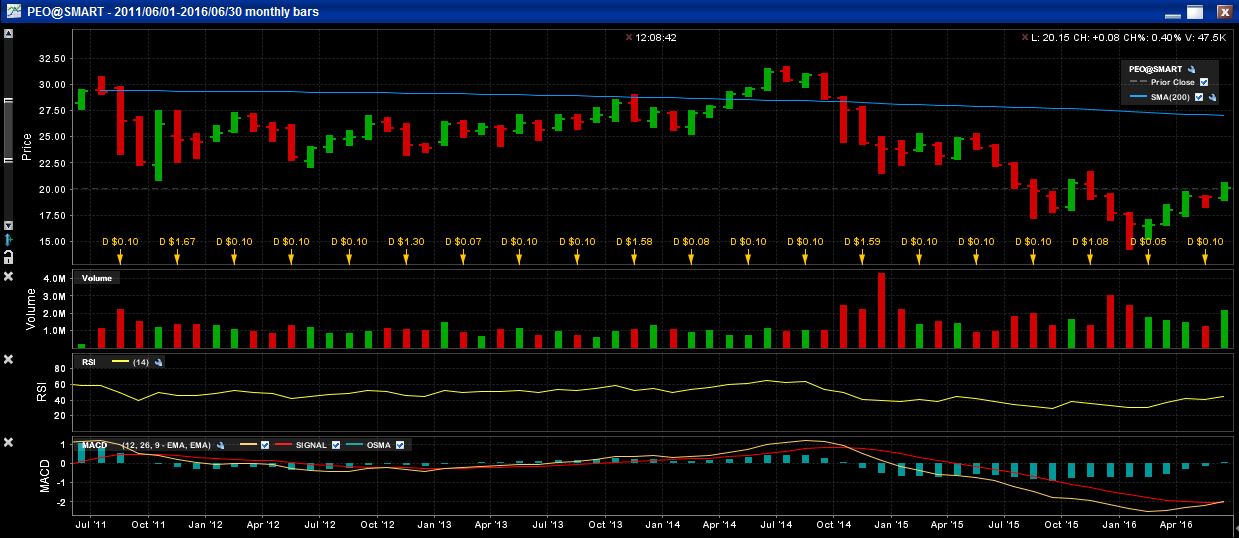
The next step is to back test each of these CEFs over the past 5 years to ascertain their returns. PEO's 5 year graph is displayed below.
Source: Interactive Brokers Web Site
Adams Natural Resources Fund, Inc. started at about $29.00 per share 5 years ago and currently sells for about $20.00 per share, a 31% capital loss over the past 5 years. In 2011, the fund distributed $1.97 per share for a 6.7% yield on $29.00 and the dividends last year (2015) amounted to $1.38 per share, a 4.7% yield on the beginning market price. Adams shows this as 6.2% yield on the market price of the stock for 2015. This fund does not qualify for the 7% portfolio since it has lost capital over the past 5 years and it is not paying 7% annually. But it has done reasonably well considering what has happened to the price of oil over that period and could certainly rebound if and when the price of oil goes up.
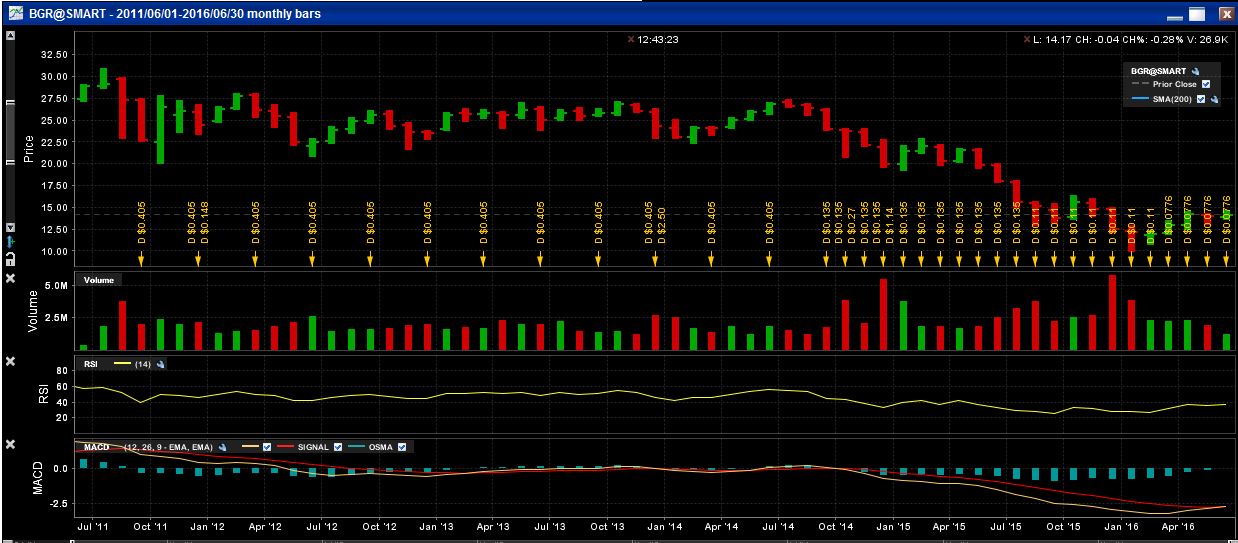
The next CEF to graph is BGR.
Source: Interactive Brokers Web Site
BlackRock Energy and Resources Trust started the 5 year period at about $28.00 per share and currently sells for around $14.00; a 50% capital loss. Using the BGR's figures, the fund paid $1.62 in 2012 and $1.495 in 2015. Based upon a $28.00 buying price in 2011-12, BGR paid a dividend that offered a 5.8% yield. The fund is currently paying $0.0776 a month to offer a $ 0.93 annual dividend which at the current selling price of $14.00 is a 6.65% return. However a dividend that has declined 38% and a market price that lost 50% indicates that everything has been going south at BGR over the past 5 years. So it is a foregone conclusion that BGR does not make the grade for this portfolio.
CEF is the next 5 year graph shown below.
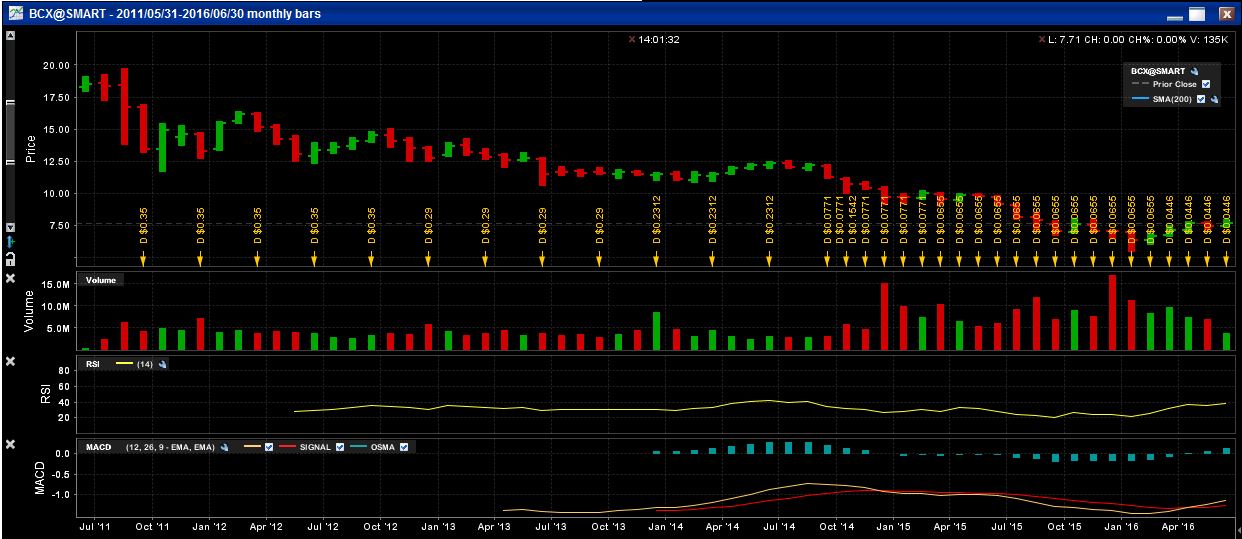
Source: Interactive Brokers Web Site
Blackrock Resources & Commodities Strategy Trust started the 5 year period at about $18.00 per share and currently sells for $7.75 per share destroying 57% of capital if one purchased the fund 5 years ago. Distributions have been declining as well; in 2012 dividends amounted to $1.34 for the year and $0.8092 for 2015. Distributions were cut from $0.0655 per month in 2015 to $0.0446 currently so that $0.5352 is the current annual distribution; a cut of over 50% from the beginning of period. This is another fund the retiree should avoid and let it to the speculators.
The 4 th graph below covers SZC.
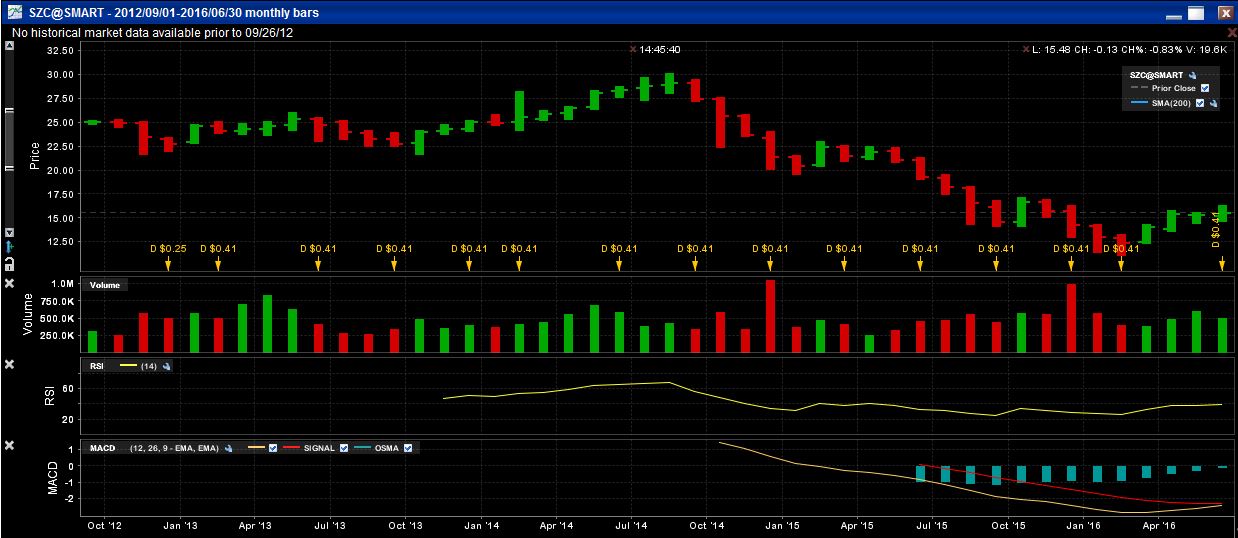
Source: Interactive Brokers Web Site
The Cushing Renaissance Fund does not quite have a 5 year history. Starting in October of 2012, the fund sold for $25.00 per share and soon started paying a quarterly dividend of $0.41 per share. It has been paying this same amount quarterly since inception and represents 6.56% distribution based on the beginning price of $25.00 per share. SZC currently sells for $15.50 per share and continues to pay $0.41 quarterly offering an enormous 10.6% cash distribution annually. However the 38% loss in capital offsets the value of the dividend. There may be a caveat here; if one believes that oil has reached its low and will be rebounding in the near future, this CEF may look like a buy. A turn around in the oil price would probably give one capital appreciation along with this fund's dividend. However this would mean taking on a certain amount of risk that could just as easily backfire.
The last CEF to back test is FIF.
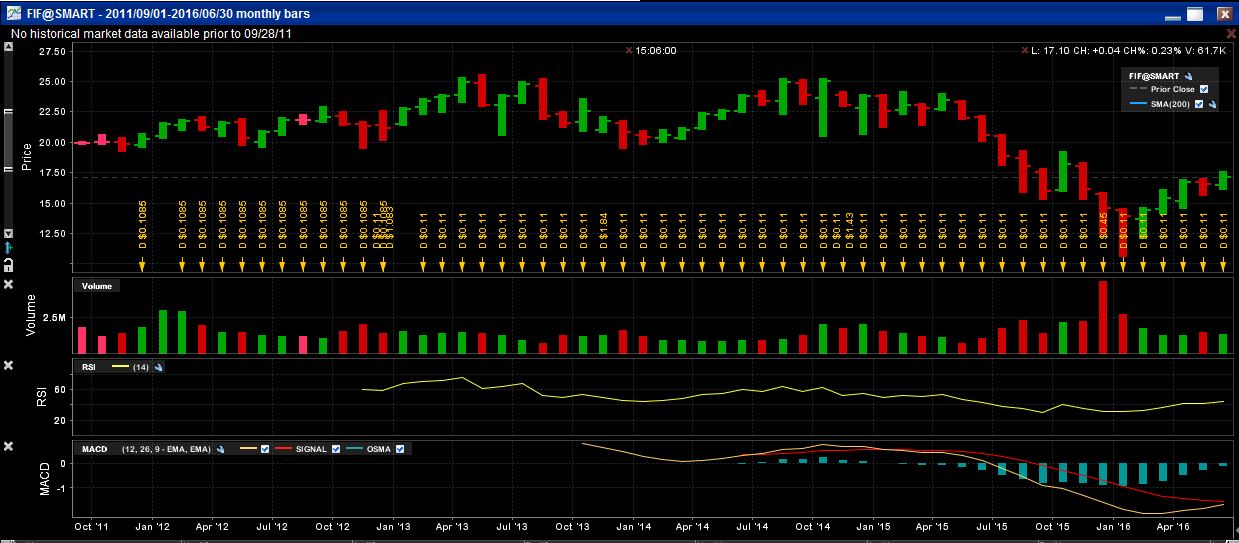
Source: Interactive Brokers Web Site
First Trust Energy Infrastructure Fund is another fund that is just shy of a 5 year history since it only started trading in September 2011. It began the 5 year period with an offering price of $20.00 per share and currently sells for $17.00 per share, a 15% loss in market price. In regards to market price, this fund held up better than the other funds covered here and take note that FIF sells at a 12% discount to its current NAV of $19.48. Distributions for 2012, the first full year amounted to $3.232 per share or about 16% if one had purchased the fund for $20.00 per share. The dividends for 2015, the last full year totaled $1.77 per share for a yield of 8.85% based upon buying the shares at the offering price at the beginning of $20.00 per share. If one were to purchase the shares now at $17.00 per share, the yield would be nearly 9% if FIF pays the same capital gains distributions as last year and 7.7% if it does not pay any capital gains distributions this year.
The obvious winner in this group of funds is FIF. It has maintained a cash return of over 7% for the past 4½ years and NAV is nearly at the same level it was when the fund was first offered. If there is any rebound in energy prices, this fund's shares should also rise with the price of the commodity producers. When I started this article I was pretty sure there wouldn't be an energy fund that would fit into this 7% portfolio. FIF is a pleasant surprise in the energy sector, but this search is not yet completed. Look for the next article that back tests energy ETFs to check if there may be a better choice available there.