One year ago, we wrote about Resource Capital Corp. (RSO) and our views on the company's preferred stock (Tickers: RSO-A, RSO-B and RSO-C). Our article was written in reaction to sharp declines in the prices of the preferred stock, specifically RSO-C which fell to $20.05 on July 21, 2015, down from $23-$24 earlier in 2015. We examined why RSO-C fell and could not find any "smoking gun" reason. Three of our key conclusions, including a buy recommendation, from last year's article are copied below:
· An investment in RSO preferred needs to be viewed as a long-term income generating investment. As a trading play, investors may continue to be frustrated.
· Investors who have a long term buy-and-hold and collect the dividend strategy may want to consider an investment in RSO preferred stock to lock in a greater than 10% annual return.
· Regardless of the merits of the preferred stock, RSO preferred stock should be placed in the higher risk bucket of income investments and is appropriate for investors with a higher risk tolerance.
Looking back one year later, RSO-C is trading at $22.30, so those who bought at $20.05 have seen a $4.40 gain ($2.15 of dividends, $2.25 stock price increase), or 22% - excellent performance. However, this gain was not achieved without major angst, as the preferred stock continued to slowly decline from $20.05 to the $18 range over the last half of 2015, and then dipped to a low of $13.68 in the "mini-panic" in late January and early February 2016, until making a full recovery and rise to over $22 per share.
Our second and third points above were thus critical - the investment had to be seen as a buy-and-hold and as a higher risk category of investment, which the high volatility proved out. This article will update our views on RSO preferred stock and conclude with an updated recommendation, specifically focused on RSO-C, which we consider the best choice among the preferred stock issues.
First, an update on RSO's business profile. RSO is structured as a REIT, but does not own any real estate, instead, it primarily acts as a commercial real estate lender with $2.4 billion in assets (down from $2.9 billion last year). RSO is similar to a Business Development Company (BDC), which makes direct loans to small and mid-size businesses, but in RSO's case, the loans are mostly asset-based loans backed by commercial real estate.
48% of loans are backed by "multifamily" properties, 22% from office properties, 20% retail and 10% hotels. RSO also operates a middle-market loan division, in direct competition with the BDCs for deal flow, with $322 million of loans outstanding. Although sometimes categorized as such, RSO is not an mREIT that purchases agency and non-agency mortgage debt, but a direct originator of commercial real estate and corporate loans.
RSO funds its loans through bank lines (currently from a $400 million line from Wells Fargo and $250 million from Morgan Stanley) and the securitization market. After amassing a certain amount of loans, RSO packages the loans into a securitization vehicle that is sold to the market and is non-recourse to RSO - the last one of these was completed in August 2015. Securitizing loans places both the loan assets and corresponding liabilities off balance sheet, freeing up capacity from the bank lines to make more loans. The off balance sheet nature of a substantial portion of RSO's assets and liabilities is critical to understanding the asset protection backing the preferred stock.
RSO is externally managed by Resource America, Inc. (REXI), an asset manager with $20 billion in assets. REXI is paid high fees, including on the face amount of the preferred stock, which we viewed as a negative for stockholders and a drag on the common stock price. In May 2016, REXI announced that it agreed to be acquired by C-III Capital Partners (closing expected in Q3 or Q4 2016), a commercial real estate services company.
With the change of control, Jonathan Cohen, current CEO of RSO, will be replaced by Robert Lieber, a C-III executive. Although the removal of Cohen is probably a good thing, we do not view the change of control as materially positive or negative. The contract to manage RSO and the shares of RSO (2.3%) held by REXI will be assumed by C-III, and there is no expectation of a reduction in management fees.
The core commercial real estate loan portfolio appears to be performing well after some losses taken in 2015. In fact, Moody's recently reaffirmed the credit ratings of two of RSO's securitization vehicles (2014-CRE2 and 2015-CRE4) with a combined $612 million in assets, noting in their credit analysis that no loans in either of the two securitizations are in default. The middle market corporate loan portfolio also has no non-performing loans as noted in the last management call. The CEO added, in a question regarding credit quality that "Things are performing well, ahead of plan and we still see… an active refinancing market."
Now let's look at the financial performance and credit statistics of RSO, and compare to one year ago. Our analysis of RSO-C will follow our methodology from July 2015. Since preferred stock is a fixed dividend paying instrument, credit analysis is more useful for our discussion. We first need to understand RSO's complex balance sheet.
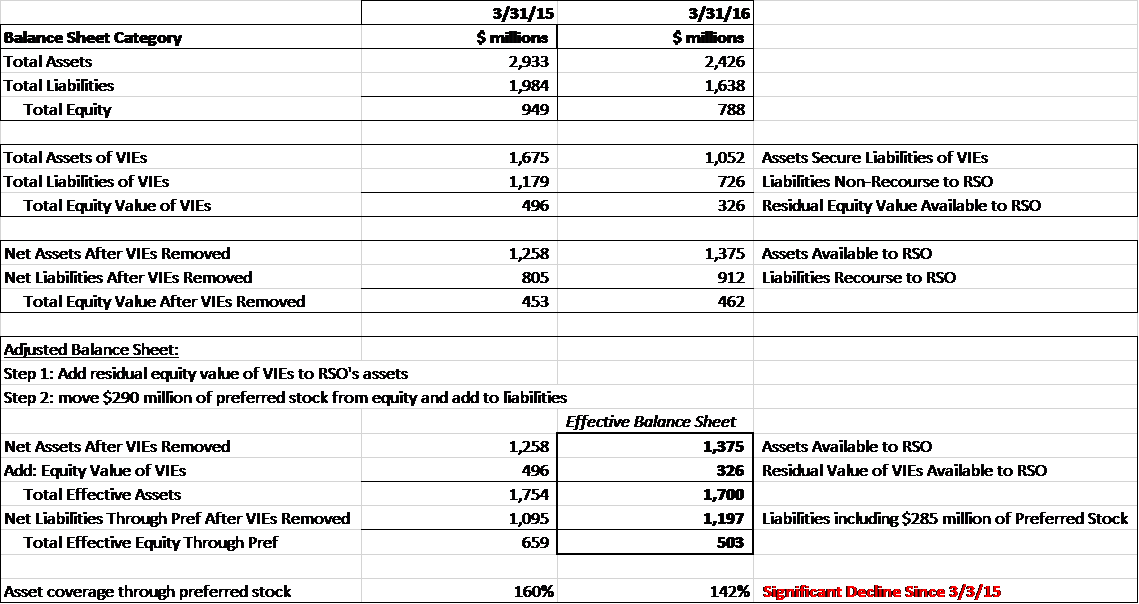
The headline balance sheet consists of $2.43 billion of assets and $1.64 billion of liabilities, which we increase by $285 million of face-value of preferred stock (down from $290 million) since from the preferred stockholder's view is a liability ahead of the equity. This brings total liabilities to $1.92 billion, leaving about $503 million of net equity value.
So assets cover total liabilities through preferred by about 1.26x, or a loan-to-value metric of 79%. This is high, and down from 1.3x and 77% last year. By assessing the effective balance sheet through stripping out non-recourse assets and liabilities, the asset coverage improves somewhat to 1.42. However, this is a significant decline from last year's 1.6x coverage and thus represents a downgrade in the credit quality of the preferred stock. We will explain below how we arrived at these numbers.
First, it is important to understand that 40-45% of RSO's assets and liabilities are held in what it calls "Variable Interest Entities" (VIEs) which are non-recourse entities but must be consolidated on the financial statements. These are the securitizations that we discussed above, of which there are four that are active today. These four non-recourse entities are effectively separate finance companies that RSO owns, each with its own set of assets and liabilities that are completely segregated from the parent company.
The assets held in the VIEs comes to $1.05 billion while the associated debt comes to $726 million. This means that on a combined basis, there is $326 million of equity value in the VIEs, or in effect, we can say that RSO owns four separate finance companies that have a $326 million combined equity value.
The chart below summarizes the balance sheet figures for 3/31/16 versus the same numbers we showed last year. The first set of rows show the headline balance sheet totals. The second set of rows shows the combined balance sheet of the VIEs, resulting in $326 million of equity value - down from $496 million last year. The third set of rows shows the balance sheet of RSO after the non-recourse asset and liabilities are stripped out.
The final box shows the adjustments to the balance sheet to add in the equity value of the VIEs ($326 million) and to add $285 million of face-value preferred stock as a liability. The resulting effective RSO balance sheet has $1.7 billion of assets and $1.2 billion of liabilities, for asset coverage of 1.42x, or a LTV of 70% (note that the preferred stock is at the back end, as secured debt comprises the first 54% of this LTV). Asset coverage has clearly deteriorated in the past year down from 1.6x.
This deterioration in credit quality should not be a surprise as RSO's performance has been weak in the past few quarters, especially in 2015. We can see this directly in the equity account, which began at $952 million on 1/1/2015 but fell to $826 million on 12/31/15. The largest hit to equity was a $41 million loan write off in Q2 2015, the largest component of $50 million in loan losses in 2015.
It does appear that this large loan loss was a one-time event related to a legacy mezzanine loan. Q1 2016 performance was reasonably fine with no loan loss provisions, and "normalized" Adjusted Funds from Operations ("AFFO") of $14.7 million, up sequentially from $11.3 million in Q4 2015 (but still well below $21.3 million of AFFO in Q1 2015). It does seem that the weakness of 2015 is behind the company, but not enough time has passed to be comfortable that the path forward will be positive. Q2 2016 numbers are a few weeks away from release.
Next, a look at cash flow and the company's ability to service the preferred stock - here too there has been a deterioration. In Q1, the company reported $14.7 million of AFFO, and adding back the preferred stock dividend of $6.1 million results in $20.8 million of AFFO available to service the preferred stock. This comes to 3.4x cash flow coverage of the preferred stock dividend - which is a reasonable ratio, but significantly less than the 4.5x level seen one year ago.
Conclusion
One year ago, RSO's key credit statistics for the preferred stock was 1.6x asset coverage and 4.5x dividend coverage. Today, these numbers are 1.42x and 3.4x, a significant reduction in credit quality. Even last year we considered RSO preferred stock as higher risk, but still recommended for the buy-and-hold investor given what we believed was still good asset coverage. We expected volatility, and this is exactly what happened to RSO preferred stock, but in the end, investors were rewarded with a 22% gain.
Our view at this time is less positive. 2015 results were weak and leverage has grown as the equity account deteriorated. Current management believes that the worst is behind the company and implemented a stock buyback program, which is a sign of confidence, but does not really provide comfort or assurances of better results ahead. The purchase by C-III can be spun both ways: first, from the buyer perspective, where C-III sees an undervalued asset with good potential for growth; second is the seller perspective, where current management knows it is time to sell as results are going to get worse. We do not know the answer so we view the change of control as a neutral event.
With all that being said, 1.42x coverage for what appears to be a healthy loan portfolio still provides a decent measure of protection, but it simply is a much lower cushion than before and less protection than we typically look for in a fixed income investment. For sure, the preferred stock will most likely be just fine and be repaid in full, but we are discussing the differences in what may be only a 1%-3% default rate and what might now be double or triple that level.
Our conclusion is that RSO-C is probably fairly priced and investors are entitled to a roughly 10% return for the risks of RSO preferred. As long as the economy and the market are reasonably stable, RSO preferred shares will likely perform, but in a recession, RSO offers little cushion to withstand a wave of defaults. We are not currently buyers of RSO preferred stock, and would consider selling holdings. A hold position is reasonable for a small portion of an investor's portfolio that is classified as higher risk (Full disclosure: we personally hold a very small position of RSO-C that we may consider selling in the near future).
Please consider Downtown Investment Advisory's subscription service through Seeking Alpha, The High Yield Bond Investor. The newsletter offers deep analysis of three recommendations per month, as well as regular exclusive insights on this asset class and other similar securities, like Exchange Traded Debt. We seek to uncover undervalued and "off the radar" opportunities. Please see our profile page for important disclaimers.