To answer the question whether energy master limited partnerships ("MLPs") have generated sufficient returns, I benchmark the performance of the Alerian MLP Index that is comprised of 44 of the most prominent energy MLPs, against the S&P 500.
The Alerian MLP Index is a float adjusted, capitalization-weighted index, whose constituents represent approximately 85% of total float-adjusted market capitalization. It is disseminated real-time on a price-return basis (AMZ) and on a total-return basis (AMZX).
In this article, I look at total returns and therefore compare the performance of the AMZX to the S&500 Total Return Index ("S&P 500").
Chart 1 depicted below is purely for the purpose of explaining the methodology. Each point on the chart is comprised of a date on the horizontal axis and a fraction on the vertical axis. The denominator of the fraction is the index level (whether AMZX or S&P 500) as of August 26, 2016. The numerator is the index level at the date indicted by the horizontal axis. For example, the value for the S&P500 as of December 31, 2015 is 0.9288 and is determined by dividing the index on that date (3,821.60) by its value as of August 26, 2016 (4,114.68). Likewise, the value for the AMZX as of December 31, 2015 is 0.8758 and is determined by dividing the index on that date (1,103.67) by its value as of August 26, 2016 (1,260.25).
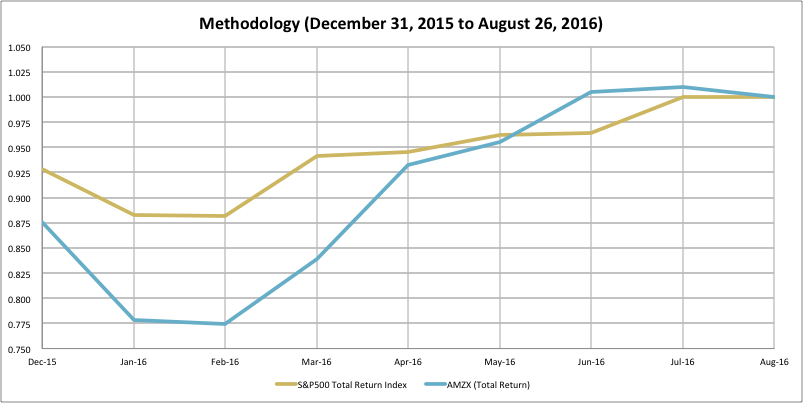
Chart 1: Illustration of Methodology. Source: www.alerian.com, www.cboe.com, and author calculations
It is easy to see the relative changes in value. Year to date the S&P 500 appreciated ~7.5% while the AMZX appreciated ~12.5%.
Even though MLPs first appeared in the mid-1980s, it took a while for them to mature as an asset class. I therefore did not go back that far and chose 1996 as my starting point. Having looked at 20-years worth of data, I discern 3 distinct periods. The first, June 1996 to June 2007, is depicted below:
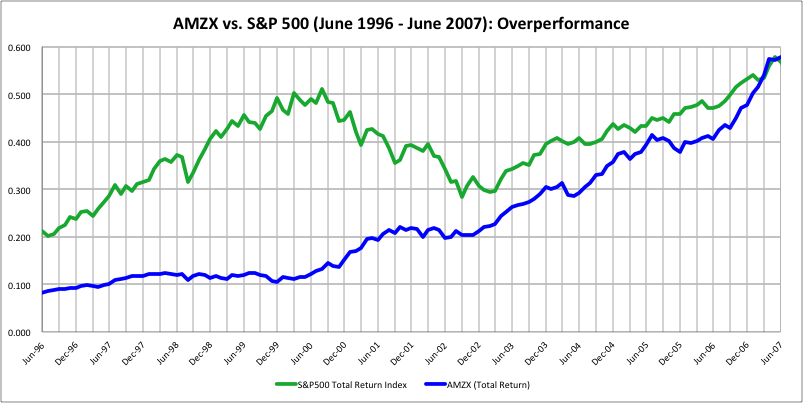
Chart 2: Superior performance. Source: www.alerian.com, www.cboe.com, and author calculations
During this 11-year period, MLPs clearly outperformed the S&P500. An investment in the AMZX made in June 1996 increased nearly 7-fold by June 2007 compared to a 2.7-fold increase of the S&P 500 in the same period. For every other entry point during this period, the AMZX provided superior returns through June 30, 2007. An entry point in August 2000 provides the maximum contrast. The S&P 500 appreciated ~11% from that point to June 2007, while the AMZX appreciated ~437%. An entry point in February 2007 provides the minimum contrast. The S&P 500 appreciated ~7% from that point to June 2007, while the AMZX appreciated ~12%. The AMZX certainly generated sufficient returns to justify an investment during this period.
The second distinct period lasted for close to 1.5 years, from June 2007 until November 2008. Overall, the performance was similar:
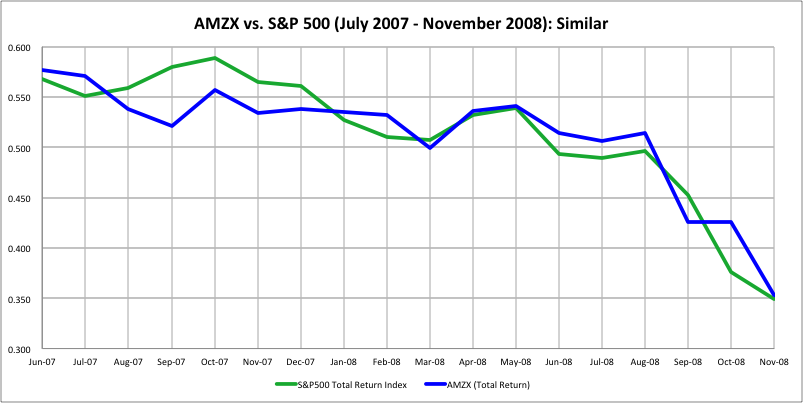
Chart 3: Similar performance. Source: www.alerian.com, www.cboe.com, and author calculations
An investment in the AMZX made in June 2007 declined by ~39% through November 2008 compared to a 38% decrease in the S&P 500 in the same period. For many other entry points during this period, the AMZX provided roughly the same returns through November 30, 2008. An entry point in September 2007 provides the maximum contrast. The S&P 500 depreciated ~39% from that point to November 2008, while the AMZX depreciated ~32%. The higher risk profile of the AMZX was not apparent during this period. The chart does not show a significant difference in volatility, so the answer as to whether the AMZX certainly generated sufficient returns to justify an investment during this period could go either way.
The third distinct period, so far of close to 8 years in length, is from November 2008 until the present. Overall performance for AMZX and S&P 500 investors entering their positions in November 2008 is the same. Both show a 283% appreciation through August 26, 2016:
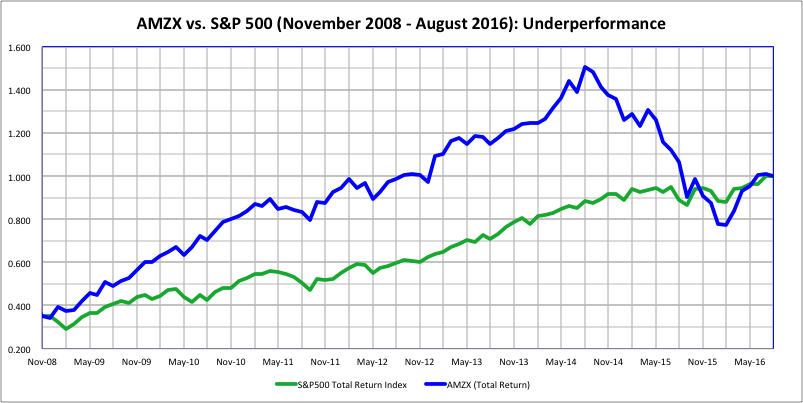
Chart 4: Under-performance. Source: www.alerian.com, www.cboe.com, and author calculations
But the higher risk profile of the AMZX is very apparent during this period. The chart shows that the similar returns were accompanied by far more volatility for the AMZX. For almost every entry point during this period, the AMZX underperformed. An entry point in August 2015 provides the maximum contrast. The S&P 500 appreciated ~28% from that point to date, while the AMZX depreciated ~50%. The only opportunity to beat the S&P 500 during this period came in February 2016. An AMZX investor astute enough to enter at that point in time outperformed the S&P 500 through August 26 (~29% appreciation vs.~13.5%. AMZX investors coming in at other entry points during this period did not generate sufficient returns to justify their investment.