Overview
The Lean Long-Term Growth Portfolio, or LLGP, was created in early February 2016. The objective of this portfolio is for long-term capital appreciation and will include companies that pay dividends. Not all companies in the portfolio are required to pay dividends however.

The portfolio will remain lean for the foreseeable future. What this means is that the number of holdings will most likely remain somewhere near the 15, or so level. The limit placed as of this update is 15. Based upon the progression of holdings, and investment opportunities, the LLGP may be split into two separate portfolios beginning next year. This will be evaluated versus increasing the holding maximum to 20.
During the month of November, the portfolio account was transferred from Scottrade to Motif. This was performed as a reaction to Scottrade being sold to TD Ameritrade Holding Corporation (AMTD), as well as the fact that current trade fees are about 30 percent cheaper on Motif.
Motif is an interesting platform as it allows investors to purchase fractional shares, build/or invest in customized motifs of up to 30 companies, and gain access to IPOs before the secondary market, led by JPMorgan Chase & Co. (JPM).
As of November 30, 2016, the fund held 13 companies including:
- The Boeing Company (BA)
- Cal-Maine Foods (CALM)
- Calavo Growers (CVGW)
- JB Hunt Transport (JBHT)
- Kansas City Southern (KSU)
- LINE Corporation (LN)
- Matson, Inc. (MATX)
- Republic Services (RSG)
- Sanderson Farms (SAFM)
- Sprouts Farmers Market (SFM)
- ULTA Salon, Cosmetics and Fragrance (ULTA)
- Unilever (UL)
- US Foods Holdings (USFD)
Source: Personal database
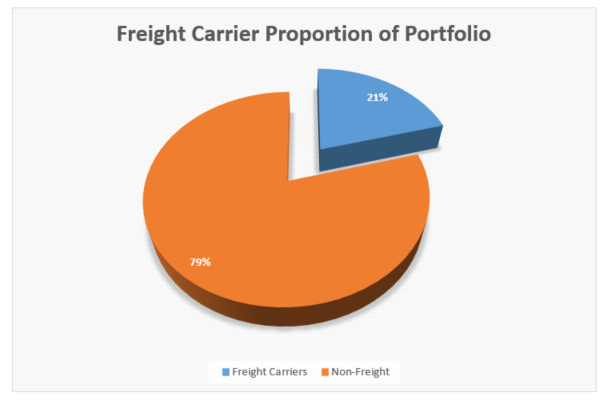
The focus of the portfolio will tend to dictate that a strong portion of the holdings will be in the freight sector. Other companies will be added to provide for a diversified portfolio based upon historical analysis. Compared to last month, the percentage of non-freight holdings within the LLGP increased substantially to nearly 80 percent. This resulted from liquidations of freight-based companies, notably Seaspan.
Current Holdings Performance - Update
As of November 30, 2016, the table below provides the stock price paid, including transaction fees, for each of the current 13 holdings. Performance for liquidated holdings is displayed. All dividend payouts are included in the performance to illustrate total returns.
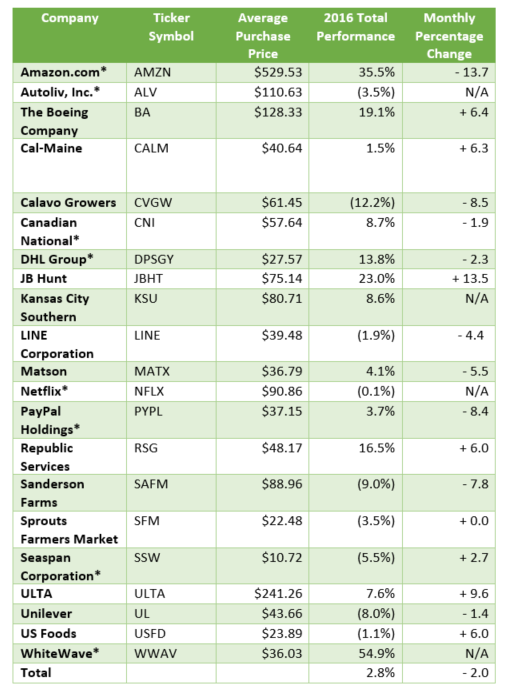
Source: Personal Database
*Note: Positions denoted by asterisk have been completely liquidated and gains/losses have been realized.
Performance in November continued to decline. This was driven from exposure to companies like Amazon and PayPal, and DHL Group and Seaspan on the freight side. While many companies rallied after the Trump results, these companies, among others displayed weakness.
The decision to fully liquidate the positions was two-fold. First, companies like Amazon and PayPal and DHL Group reflect large market capitalizations. A core focus of the portfolio is to invest in small to mid-cap holdings. Second, Seaspan was determined to be too risky. During November, the position was built up substantially to minimize losses.
While the broader market indices have rallied, transport indices have risen at a substantially greater pace. Many companies have become highly overvalued based upon speculative prospects. For this reason, companies including JB Hunt, Matson, Sprouts and US Foods also had majority positions liquidated. These moves have raised substantial cash. Kansas City Southern was swapped for Canadian National as a risk-play based upon negative trade speculation.
Source: Personal Database
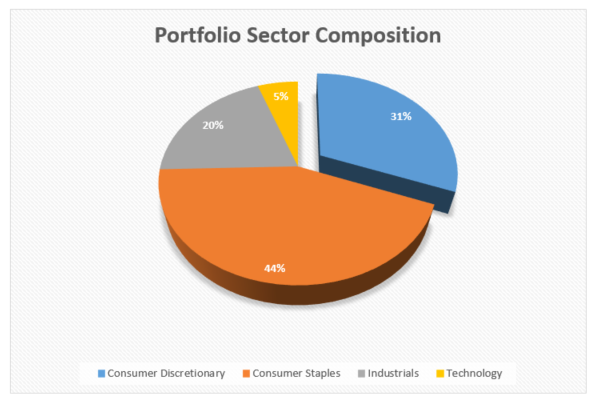
Since these moves were significant, the portfolio's sector composition has changed dramatically. Consumer staples now represents the largest portion at nearly 45 percent, followed by consumer discretionary and industrials. Seaspan and Sprouts had the greatest impacts on these shifts as they reflected the largest weightings prior to liquidation.
These shifts will likely continue in the near-term, but should moderate as the invested amount increases over time.
Source: Personal Database
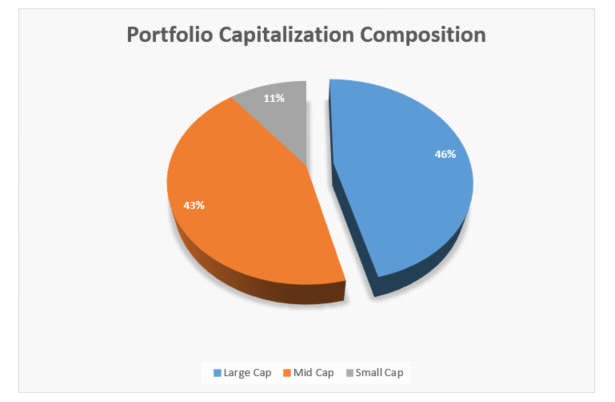
These adjustments have led to both large and small cap compositions dominating; nearly 90 percent of the composition is weighted in these two categories. The combined nearly 55 percent mid and small cap weighting is preferable. While large cap companies may still offer robust growth potential, mid and small cap opportunities are the focus.
Source: Personal database
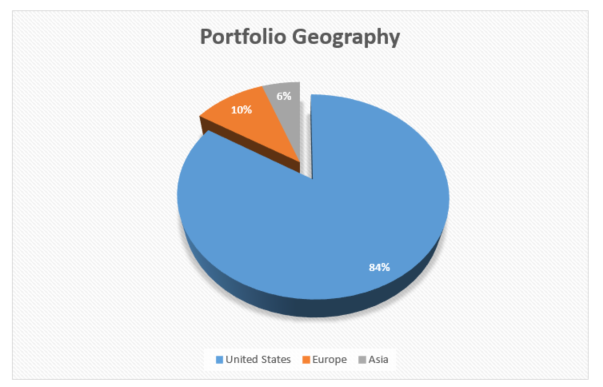
The increase in exposure to U.S.-based companies rose because of management actions. The expectation is that the U.S. will continue to reflect the substantial majority of the holdings. European companies will likely remain volatile with Brexit; Chinese companies continue to hold promise, but the lack of legal structure and direct equity ownership remain risks.
Source: Personal database
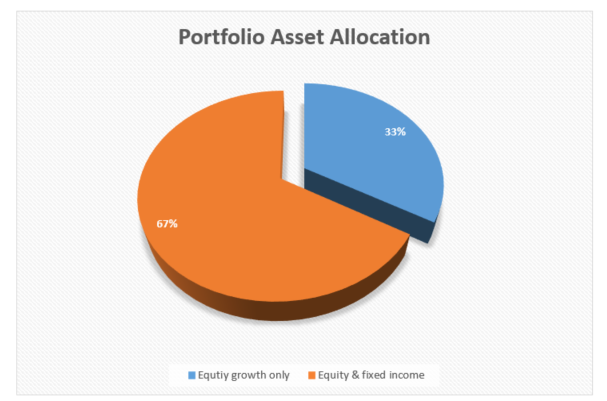
The shift in holdings did not have as great of an impact upon the balance between equity only versus equity and fixed income growth companies. As many of the holdings are expected to continue to appreciate at a high rate over time, dividend yields are expected to remain below two percent on aggregate.
Benchmark Comparison and Performance
As noted, the portfolio was developed in February 2016; as such, the benchmark performance below is as of February 4, 2016, to provide a comparable review.
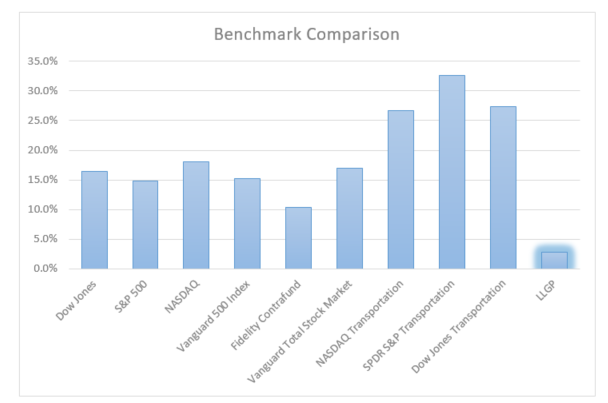
Source: Yahoo! Finance and Personal Database
To date, the portfolio has returned 2.8 percent, including dividends. The portfolio has substantially underperformed all its primary benchmarks through November. Most benchmarks witnessed strong gains for the month of November, stemming from the Trump election results.
Transport indices have performed astronomically, in certain instances doubling and/or tripling broader market indices. Further additions to the fund have diluted previous gains. Realized losses have also impacted performance, as Seaspan and Sprouts reflected the largest weighting. The "build-up" effect of the fund will still be present next year, but should begin to abate.
The LLGP expense ratio stood at 1.5 percent from all transactions for the year. It should be noted that all performance includes transaction costs, so the 2.8 performance is the pure return to date of the portfolio. The LLGP YOC was at 0.6 percent through November 2016. The YOC is forecast to be at 1.4 percent during 2017. This forecasted amount is subject to change based upon future dividend increases and/or further dividend paying holdings to the portfolio.
Conclusion
April performance witnessed a decline of 1.9 percentage points, May witnessed a decline of 2.2 percentage points, June witnessed a decline of 2.5 percentage points, July witnessed improvement of 5.1 percentage points, August was flat at negative 0.2 percentage points, September was flat at 0.1 percentage points and October witnessed a decline of 1.9 percentage points. The negative two percentage point decline during November reflected the fifth declining month for the year.
Additional rules and parameters have been established to minimize the frequency of buying and selling existing holdings. These include limits for annual investment amounts per holding, as well as maximum short-term amounts to manage volatility. The transition to Motif will allow for greater flexibility due to lower costs. The strong amount of cash raised will be used to continue to manage existing holdings and for future additions.