There are many times when I won't be able to immediately add a mortgage REIT to my coverage group, but Arlington Asset Investment Corporation (AI) is getting added into the mix. It was a recent subscriber request, and their portfolio matches nicely with the way I run portfolio estimates. However, I must add a substantial caveat. AI changes their hedging strategy at least occasionally and it is entirely possible that they might have changed their strategy between the end of the third quarter and the point in the fourth quarter when yields took off. I do not consider it likely, but it is possible.
What Should You Know About AI?
The company is a C-Corp acting in an area dominated by mortgage REITs. They also have a huge asset for prepaid taxes. Their GAAP BV which includes the asset was $18.83 and their tangible BV (which excludes it) was $14.63.
I believe both values should be used in finding the fair value for AI, but I would place a larger value on tangible BV. The tax assets cannot be used as collateral so they do not work well with repurchase agreements. That could be a challenge to leverage, but it turns out AI runs extremely high on leverage.
Comparing their total MBS portfolio (including TBA commitments) to tangible equity leads to a ratio of about 14.4 to 1. If use GAAP equity, it would drop to 11.2 to 1.
Next, I should point out that they are heavily using TBA commitments to ramp up their economic leverage. The GAAP leverage figures, which ignore the notional balance on the TBA commitments, are going to appear lower.
Portfolio
Their portfolio is extremely simple compared to most of the portfolios I have to model, with one exception. We'll get the exception later.
The major factors are that they are moving out of non-agency RMBS and it is now a very small portion of their portfolio. They are very heavily invested in 3 securities, counting their TBA commitment.
Security 1: TBA Commitments on 3% 30-year fixed-rate RMBS
Security 2: 3.5% 30-Year Fixed-rate specified pool agency RMBS
Security 3: 4.0% 30-Year Fixed-rate specified pool agency RMBS
While specified pools can be more difficult to model than generic pools, the RMBS assets are very simple because this is only 3 exposures.
The exception to this rule is their use of options on "Treasury Futures" contracts. The way they were handling their exposure to Treasury Futures was changing from quarter to quarter (I went through the last 3 quarters), but going into Q3 they were buying the puts, selling the calls (same strike date, different strike price), and buying some very far out of the money calls as a hedge against extreme movements.
These options are designed to focus on the yield of the 10-year Treasury Futures contract rather than the price, but the ultimate goal is the same. The value of their position increases when rates rise and decreases when rates fall. The positions are shown in the chart below:
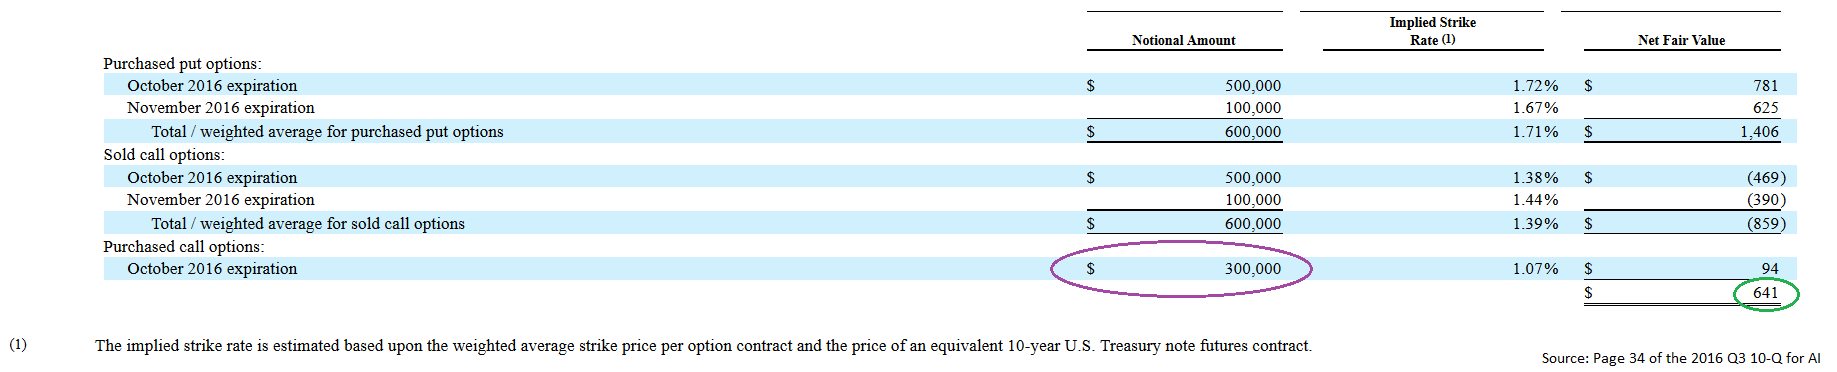
For simplicity sake, I put a purple circle around the portion of the position that is merely there to hedge from a sudden and dramatic drop in yields. The green circle is there to highlight the net premium of the position which would decay over time if rates didn't move.
The challenging factor here as an analyst is that 83% of the options expire in October. This begs the question whether the mREIT is going to roll the positions. Further, we have to ask when in "October" does the October option expire. According to CME Group, the Treasury Futures contract settles on the seventh business day preceding the last business day in the month. In simpler terms, that means around the 20 th. I would expect the options to align with the Treasury Futures contracts the options are based on.
We know rates didn't sky rocket until November 9 th, so it is absolutely critical to the analysis that AI was rolling this position or picking up a short position directly in the security when the options were expiring. If AI did not maintain this hedge against the 10-year Treasury rate, the expected book value is substantially different.
How Important Was The Hedge?
I'm modeling the changes based off Treasury rates rather than using Treasury Futures contracts directly. I may look to change this strategy, but for now, it gives a decent estimate. Based off the shift in Treasury rates, I would put the fair value change around $49 million. There were about 23 million common shares outstanding and $49 million divided by 23 million shares suggests a value of about $2.13 per share relied on this hedge. This seems fairly accurate based on a 94 basis point movement. Management's guidance stated that if rates jumped higher by 100 basis points the gain on this position would be $53.1 million.
Book Value Estimates
I put together a full revaluation of the portfolio to come to the estimated book value. Charts are in the extended version of the article. The simple math is that tangible book value (excluding impacts on the tax assets) should be relatively flat on the quarter so long as the hedges were maintained 100% of the time. If the hedges expired and were not replaced prior to the huge pop in yields, book value would be significantly damaged.
I believe it is most likely that the mREIT maintained a similar exposure to duration over the quarter, but modeling for portfolios that include options that expire within the current quarter creates a significant risk.
Absurdly Strong BV Performance
The book value performance implied here is absurdly strong relative to the sector and relates to the company using a substantial position in the options on Treasury Futures contracts.
Since I'm adding AI into my model, I wanted to do some back testing on the prior two quarters. I simplified the model for those periods by eliminating dividend payments and net interest accrual (which should offset almost perfectly) and left out the Treasury Futures which were far less important in prior quarters. My model over estimated tangible BV by $.14 for Q2 (about 1%) and underestimated it by $.06 for Q3 (under .5%). Note that these estimates were built with the values from the start of the respective quarters, rather than doing it the lazy mode with current positions.
Consequently, I think these estimates should be fairly solid so l ong as management rolled their options positions or established a short position after the options expired. If they did not maintain that position, their book value would be much weaker.
Outlook on AI
I think the price to tangible book value ratio is too high. I love the steeper yield curve, but I don't think it is enough. It is important to point out that the idea of a steeper yield curve being a large positive factor for mREITs relies on the mREIT running positive duration (taking on more interest rate risk). The reason AI didn't get crushed like many of their peers is because they went very heavy on hedging.
Extended Version
There is an extended version of this article that gets into comparing discounts to tangible book value across time and across the sector as well as providing a short discussion of the dividend. That article is already available to subscribers of the Mortgage REIT Forum. The Mortgage REIT Forum is the most effective way for me to get my research to investors immediately. Due to the costs of running the system and the time required to prepare the pieces, I intend to raise rates in January 2017, but I am still allowing subscribers to automatically lock in their rates when they purchase a subscription. Those subscriptions are only $240/year if you sign up during December 2016. If you're thinking about it, why not check out the reviews from my subscribers. The Mortgage REIT Forum averages 3 articles per week. One provides updated book value estimates for several mortgage REITs and includes my ratings (adjusted each week). The second article rates the different preferred shares and shows investors which ones are offering the best bargains. The third is used to highlight individual stocks and market failures or to provide a sneak preview on the articles I'm planning to publish over the next couple weeks.
Disclaimer: Information in this article represents the opinion of the analyst. All statements are represented as opinions, rather than facts, and should not be construed as advice to buy or sell a security. This article is prepared solely for publication on Seeking Alpha and any reproduction of it on other sites is unauthorized. Ratings of “outperform” and “underperform” reflect the analyst’s estimation of a divergence between the market value for a security and the price that would be appropriate given the potential for risks and returns relative to other securities. The analyst does not know your particular objectives for returns or constraints upon investing. All investors are encouraged to do their own research before making any investment decision. Information is regularly obtained from Yahoo Finance, Google Finance, and SEC Database. If Yahoo, Google, or the SEC database contained faulty or old information it could be incorporated into my analysis.