As ETF Monkey, I have written for Seeking Alpha for almost two years. However, it wasn't until October, 2016 that I offered readers their first glimpse into my personal portfolio. The main purpose of that article was to demonstrate to readers that I "practice what I preach." In other words, that I am not advocating my readers do one thing while I myself do something vastly different.
Since that time, and in connection with updates I have written on my various model portfolios, several readers have asked for an update as to my own activity. I agreed to do so at the end of the year. So here it is, the 2016 year-end update!
In that initial article, I explained in great detail how I track the portfolio in Excel, including various color-coding techniques to visually draw certain things to my attention. I won't bore you by repeating any of that here. Additionally, I spent a fair amount of time explaining the reasoning behind inclusion of the various ETFs and individual stocks in my portfolio. Again, I won't bore you by repeating any of this, I will instead highlight any areas where I have made adjustments.
The Big Picture
Here is how the portfolio stood as of the end of the last trading day of the year. Have a look, and then I will offer a few comments.
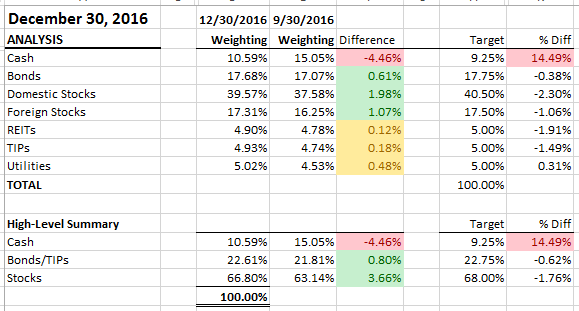
This is basically the same picture as in the original article. I mentioned that I have 'snapshots' at two different levels. You might think of these as "the big picture" and "the really big picture."
The only difference is, well, the 'Difference' column. That's new. It shows, at a high level, the change in weighting of each asset class between the end of Q3 and year-end. You will notice three different colors in this particular column; yellow, red & green. Here is the logic I decided on for those colors:
- Yellow - Any asset class which either increased or decreased by a half-percent (.50%) or less. In other words, the asset classes where the weighting between Q3 and Q4 was more or less unchanged.
- Green - Any asset class which increased by more than .50%
- Red - Any asset class which decreased by more than .50%.
Using this analysis worksheet, what can you quickly determine about my activity during Q4? Basically, that I put a little of that excess cash to use in U.S. stocks, foreign stocks, and bonds. At the same time, with the minor exception of Utilities, each asset class remained slightly underweight against its target, in favor of holding a small amount of extra cash. I'll get into a little more detail in the next section.
The Devil's In the Details
First off, to create the necessary links and references, here are my positions in alphabetical order.
| Ticker | Stock/ETF |
|---|---|
| AAPL | APPLE INC |
| AGG | ISHARES CORE U.S. AGGREGATE BOND ETF |
| BND | VANGUARD TOTAL BOND MARKET ETF |
| BSV | VANGUARD SHORT TERM BOND ETF |
| DIA | SPDR DOW JONES INDL AVERAGE ETF |
| FDRXX | FIDELITY GOVERNMENT CASH RESERVES |
| HDV | ISHARES CORE HIGH DIVIDEND ETF |
| IEFA | ISHARES TRUST CORE MSCI EAFE ETF |
| ITOT | ISHARES CORE S&P TOTAL US STOCK MARKET ETF |
| IXUS | ISHARES TRUST CORE MSCI TOTAL INTL STK ETF |
| JMBA | JAMBA INC |
| SPAXX | FIDELITY GOVERNMENT MONEY MARKET |
| T | AT&T INC |
| TIP | ISHARES TIPS BOND ETF |
| VEU | VANGUARD FTSE ALL-WORLD EX-US INDEX |
| VHT | VANGUARD HEALTH CARE ETF |
| VIG | VANGUARD DIVIDEND APPRECIATION INDEX |
| VNQ | VANGUARD INDEX FDS VANGUARD REIT ETF |
| VPU | VANGUARD UTILITIES ETF |
| VTI | VANGUARD TOTAL STOCK MARKET ETF |
| VWO | VANGUARD FTSE EMERGING MARKETS ETF |
| VYM | VANGUARD WHITEHALL LANE HIGH DIVIDEND YIELD ETF |
| VZ | VERIZON COMMUNICATIONS |
Next, here is the section from my tracking spreadsheet which lists each position in descending order by weight.
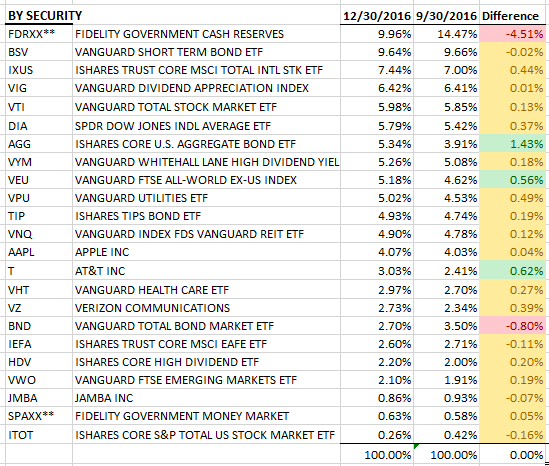
Again, the extra column with the yellow, red & green color coding, except this time calculated on each position. Now that you know that, you can pretty much figure out where the movement was. Let me fill in the details with a brief narrative. First, though, here's a quick picture that may help to understand.
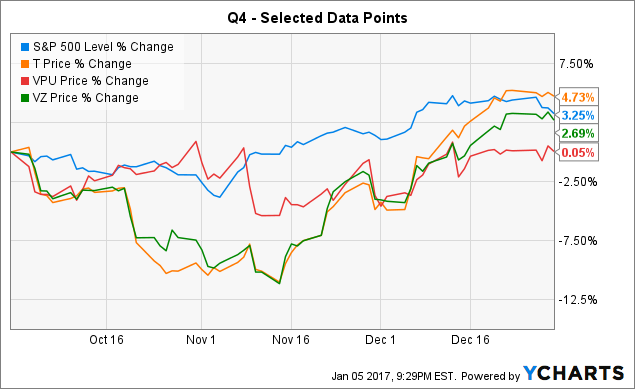
As can be seen, the overall market declined by roughly 3% between September 30 and early-November. Certain interest-rate sensitive assets, represented by T, VZ and VPU in the picture, declined even further.
Following Donald Trump's election, interest rates rose, dropping prices on bonds, REITS and TIPS. At the same time, a few holdings staged stunning turnarounds. Look at the sharp rise in T and VZ as an example. So, at the same time I added to bonds, REITS and TIPS, I actually sold a little of the very same stuff I bought early in the quarter, so I would not be so dramatically overweight.
As mentioned, in my previous article I went into a detailed explanation of the rationale behind my holdings in each asset class. This time, I will simply comment on activity in each class since that update.
Total U.S. Stock Market: ITOT / VTI
My weighting in ITOT and VTI is basically unchanged since the last update. I concluded the last update by observing that my weighting in these core holdings is not exactly where I would like it to be. My goal is for between 10-15% of my total portfolio to be in these ETFs. Currently, their combined weighting is only 6.24%. As mentioned in the previous update, this is because I chose ITOT as my vehicle to lower my overall weighting in domestic stocks.
Dividend Growth & High-Dividend: DIA / HDV / VIG / VYM
In a previous article, I explained why I consider dividends, along with low costs and diversification, to be solid anchors for your portfolio.
I included these specific ETFs to increase the overall quality of my holdings, as well as my dividend income. Other than adding a tiny amount of HDV in my "non-retirement" investment account, this category is unchanged from the previous update. Again, I will likely add to ITOT to increase my exposure to the broader market, including smaller companies, before I add further to these.
Specialty Sectors: VHT / VNQ / VPU
I added a little to each of these positions during Q4. All 3 of these asset classes experienced a fairly sharp decline during the quarter, and I simply took the opportunity to add to these positions on weakness.
Foreign Stocks: IEFA / IXUS / VEU / VWO
With the exception of IEFA, I added small positions in each of these ETFs during the quarter. While domestic stocks rocketed upward during Q4, this asset group continued to lag.
In my recent interview with Seeking Alpha, I selected emerging stocks as my highest-conviction pick for 2017. Again, because I practice what I preach, I added to this segment on weakness, adding shares of VWO on December 22, shortly after that interview was published.
Bonds & TIPS: AGG / BND / BSV / TIP
With the exception of BND, I added small positions in each of these ETFs starting around November 15. Following Trump's election, interest rates took a sharp upwards jump, and the prices on these ETFs dropped accordingly. As just one example, AGG closed at $111.83 on October 21. By late-November it traded in the low $108 range and dropped to a low close of $107.16 on December 15, a decline of 4.18% from the October 21 close (and even more from its peak for the year in the $113 range in July).
Essentially, this was nothing more than rebalancing to get my weightings back to target. I did, however, make one small move to reduce trading expenses in my non-retirement account. Due to the drop in prices, BND dropped to basically breakeven with my overall purchase cost. Once I did not have to pay taxes on the transaction, I swapped it out for AGG, which I can trade commission-free. That explains that nice 1.43% increase in AGG in my table of detailed positions above.
Individual Stocks: AAPL / JMBA / T / VZ
As I alluded to above, both T and VZ dropped very sharply between 9/30 and 11/15 and then rose just as sharply into yearend. I actually added fairly significantly to my positions in each on the sharp drop, and then sold approximately half of what I added in late-December when their sharp turnaround left me significantly overweight. However, I ended the quarter with more shares in each than at the beginning.
Overall, AAPL and JMBA were unchanged during the quarter. However, AAPL behaved very similarly to T & VZ during the quarter, taking a sharp drop into mid-November then rising sharply into yearend. So, I managed to pull off a small trade, buying a little at around $107 and selling the same shares at $115 a month later.
Just for emphasis, however, all of these moves were pretty much dictated by the movement of their relative weightings in my portfolio, not because of any great brilliance on my part.
My Personal Performance vs. My Model Portfolios
So how did my personal portfolio perform in 2017 compared to my model portfolios? As might be expected, quite similarly. My personal portfolio generated an overall return of 8.83% for the year. That compares against a return of 9.30% for The ETF Monkey Vanguard Core Portfolio and an average return of 7.43% for the three implementations of The ETF Monkey 2016 Model Portfolio.
Summary and Conclusion
In that recent interview with Seeking Alpha mentioned above, I was asked whether I was bullish or bearish on the equities market outlook as we entered 2017. Here's my reply:
In general, I have to say I lean towards the bearish side. There are so many unknowns. The market has rallied strongly since Donald Trump became President-elect, presumably based on a stronger pro-business outlook. But exactly what he intends to do - and how he intends to do it - remains somewhat murky. . . . Next, if we look outside the borders of the U.S., the world isn't exactly a stable, peaceful place. . . . Lastly, central banks have already used most, if not all, the "traditional" arrows in their quivers, so to speak, and have even ventured into uncharted waters.
I'm not trying to compete with Mark Faber for "pessimist of the year." It's just that there seems to be a ton of uncertainty out there, and I wonder if many investors are just ignoring it, hoping they can be "first out of the pool" if things go south.
In this year-end peek into my own portfolio, you can see how I have elected to deal with this when it comes to something very important to me; my own money. Again, I hope you see a level of consistency between what I advocate, and actually practice.
Until next time, I wish you . . .
Happy investing!
Author's note: At the top of this article, next to my name, you will see a "Follow" button. If you like my work, I would be profoundly grateful if you would take a minute to do this, as well as feature my work to friends, colleagues and/or relatives who may be interested in the subject matter. Growing one's readership base is critical to any author and I am no exception. Your support will enable me to continue my efforts.