American Express (NYSE:AXP) has been on my research list for a while now. I have, however, not yet found the time to review its FCF performance. After my previous article on AT&T (T) I opened another reader poll to see which company should receive the "FCF 5" treatment next. You chose American Express by some margin (incidentally, the fresh poll has now been opened so please go ahead and vote for the next company).
American Express's FY2016 ended on 31 December, but it will not be until February that we get those results. Nonetheless, just before they come out it certainly seemed opportune to take a look at the historic FCF position of this iconic credit card and traveler's cheque giant.
Although far from exhaustive, my five FCF tests give me a good indication of a company's competitive advantages, FCF health and efficiency, as well as the debt and dividend position. Fair value based on FCF alone is also calculated to give a little taste of whether it offers value today. These tests merely mark the first step in what may develop into a more thorough analysis of the business in the future.
In American Express's case the picture is (as with AT&T previously) pretty complex. The picture presented is of a compellingly cash-generative business with a very healthy-if modest-dividend trading at a fair but hardly bargain price. Yet its debt position and cash-generating efficiency is where it is let down to some extent. Nonetheless, as becomes clear, the company seems to be making solid progress towards offering investors a more consistently compelling picture.
A Little About American Express
First, a little about the company itself. American Express's iconic US consumer cards business is perhaps the most familiar product it delivers. Similarly, it also represents the greatest contributor to revenue and income. Yet as well as its own-branded and managed consumer cards (both in the US and globally) it also has business segments operating for commercial clients, co-branded cards and other institutions which use their network to provide their own services:
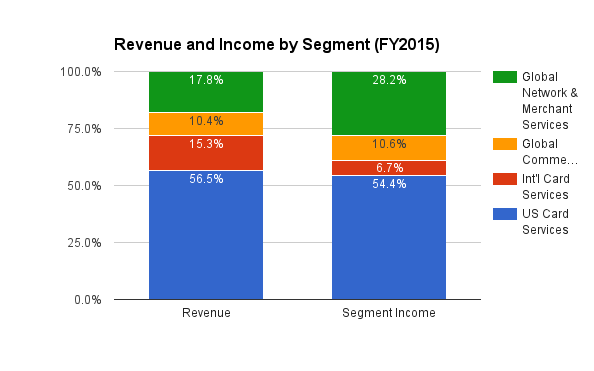
All told, this is a fairly attractive and focused revenue picture. Nonetheless, what is clear is that the bulk of its top and bottom line is derived from its core business in the US:
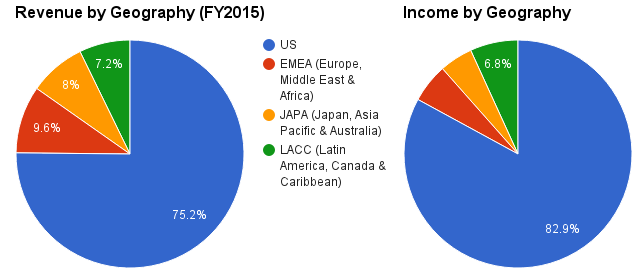
American Express's fate is, therefore, very closely tied to the health of the US economy and especially its consumer credit health. Yet they tend to have an attractively high-quality exposure to US consumer risk with an average US consumer card FICO credit score of 764. Very attractive indeed.
This is all very encouraging. Yet what I want to see is that this is supported by a business with a strong set of FCF metrics. So let's get started with my "5 FCF" tests and take a closer look.
1: Positive FCF
First off is the simplest of the tests: has American Express consistently produced positive FCF over the last decade. At this stage, this is all we demand. So how does American Express do? Very well indeed:
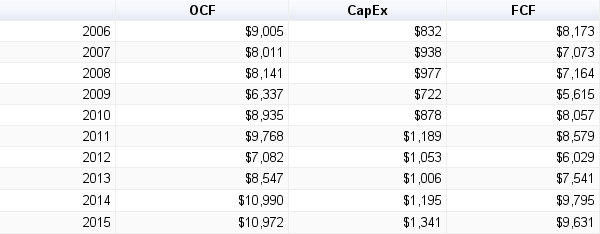
Year after year American Express has managed to produced considerable amounts of FCF. Although FCF growth has been pretty lumpy, the company has also ended the last 10 years with more FCF than it entered it with. That is excellent to see.
What is more, the 9 months of FY2016 already reported to date suggest positive FCF is likely again:
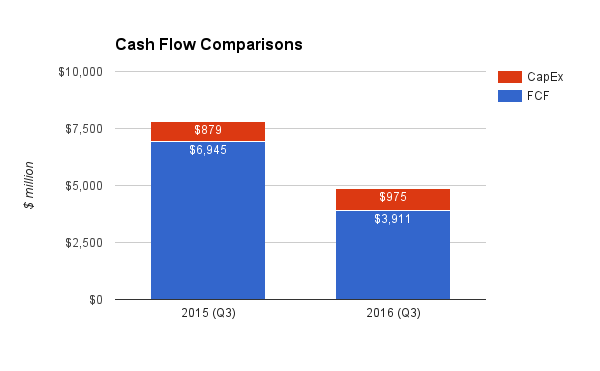
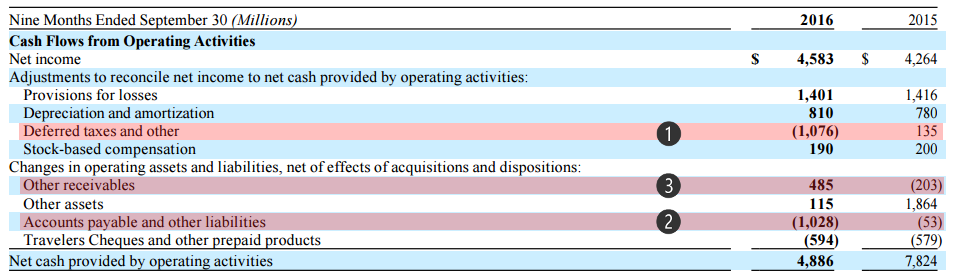
Certainly, FCF levels appear to have fallen sharply. Yet looking at the actual cash flow statement reveals that the shortfall is chiefly driven by payment of deferred taxes (see point 1 below) and a tighter payment of their bills (see "Accounts Payable" at 2) only slightly offset by delays by some in paying their bills to American Express (see "Receivables" at 3):
The reality is, therefore, that underlying cash flow remains very strong. All told, American Express easily PASSES this first test.
2: FCF to Debt
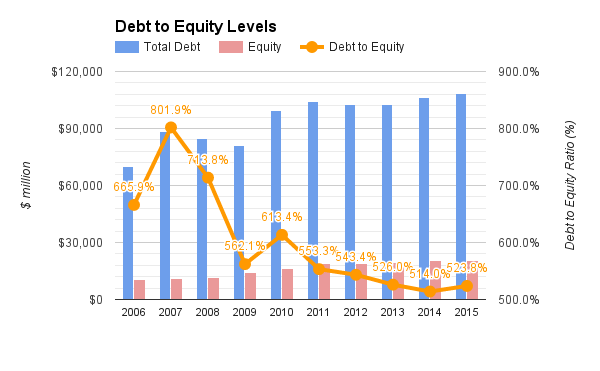
Next we turn to their debt levels. American Express has pretty staggering levels of debt on their books when looked at from a Debt to Equity perspective:
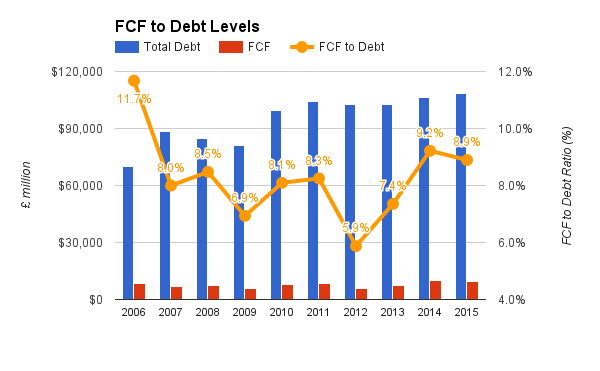
This does not translate very well into my next test: FCF to Debt ratio. Here I am after a FCF to Debt ratio of 25% or more. In other words, I want to see American Express in a position in which they could-in theory-repay their entire debt load in four years or less using only their FCF.
Despite their undoubtedly impressive FCF, however, this debt level leaves them noticeably below this target:
Even when adjusting for their equally hefty levels of cash on their balance sheet, their net debt to equity levels (although improved) are hardly any more comforting to look at:
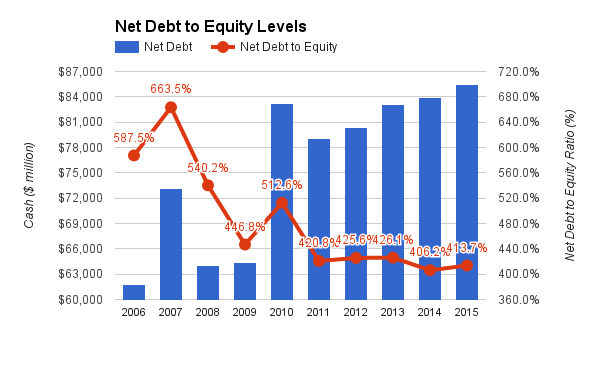
Certainly, even accounting for this it still leaves American Express considerably short of my targeted 25% or more FCF to Debt ratio. At 11.3% it would take about 9 years to repay their entire debt using FCF alone.
Yet, for American Express, this does not tell the whole story.
Customer deposit levels on the balance sheet American Express to some extent foggy the picture. Customer deposits are the cash handed to American Express which they then lend out to other customers to earn profit through interest payments (some of which is handed back to depositors in interest). These deposits are, however, treated as being liabilities and thus contribute to the total debt figure at American Express.
These customer deposits, however, are "good debt" as they are the lifeblood of their earnings power. As a result, treating them as debt in the above figure is not really telling me what I want to learn from this process: the ability of the company to handle their genuine "bad debt" (that is the debt that will constrain earnings and cash flow).
If we look at the breakdown of the debt it becomes clear that their actual "bad" debt levels have been decreasing with customer deposits being the main cause for overall debt levels to rise:
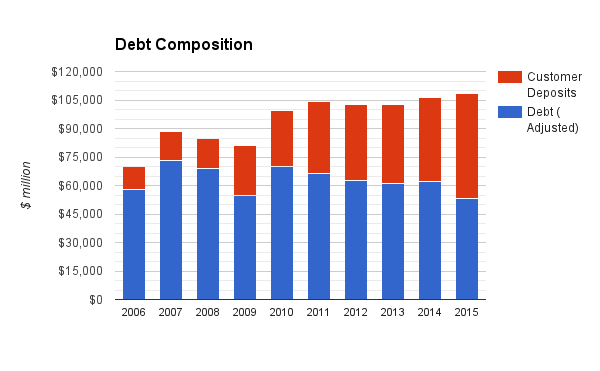
If we look at the FCF to Debt ratio only related to the debt without customer deposits included, the ratio looks far more favourable for American Express:
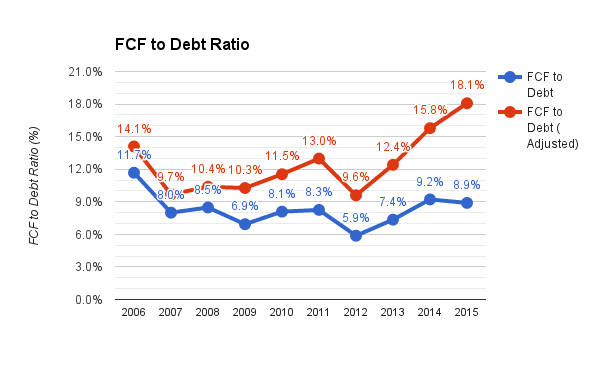
Although at 18.1%, American Express remains below my 25% target it is clear that they are fast approaching that figure with their growing FCF and progressively declining "bad" debt levels. Indeed, at Q3 2016 results time their debt levels had fallen further once more:
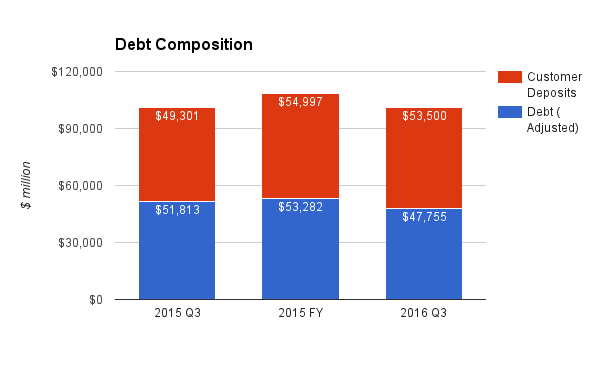
This suggests that once FY2016 results come in American Express may well edge even closer to passing my 25% threshold.
For now, however, they are falling short and even with declining bad debt levels are likely to remain so in FY2016. As a result, they have to earn a FAIL here. They are fast improving upon their performance, however. This is certainly something to be watching.
3: CROIC
Our next test turns to American Express's cash flow efficiency. We judge this using their CROIC-or cash return on invested capital-calculated by dividing their FCF by the sum of their invested capital (sum of their total debt and shareholders' equity). On this occasion, as customer deposits count towards capital invested in the business we include customer deposits within the debt figure in the above calculation.
What we are looking for here is a CROIC which has averaged over 10% over the last decade. What this means is that for every $100 invested in the business, they have on average generated $10 or more in FCF. This is a highly attractive rate of return to support their investment and shareholder returns activities. So how does American Express do? Well, despite historical levels above my target they have in recent years struggled to do the same: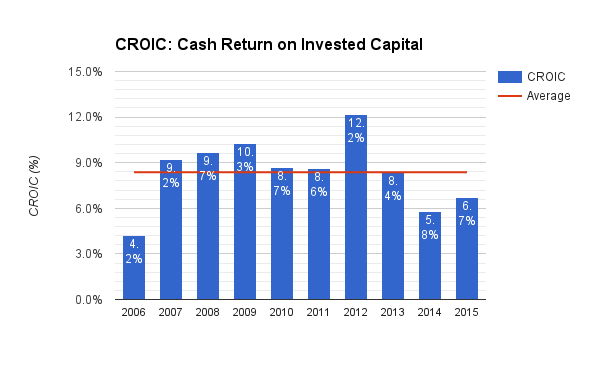
Weakness in recent years has left them with a 10 year average of just 7.1%. This is still a decent CROIC figure, yet it remains behind my targeted 10%. As a result, American Express has to earn a FAIL here for now.
4: FCF Dividend
Next we turn to the dividend. Generally speaking their dividend yield has been fairly unspectacular. Except for in 2008 when their share price dropped dramatically for a short period of time, their yield has been consistently in the mid-1% sort of range with the 10-year average sitting at 1.6%: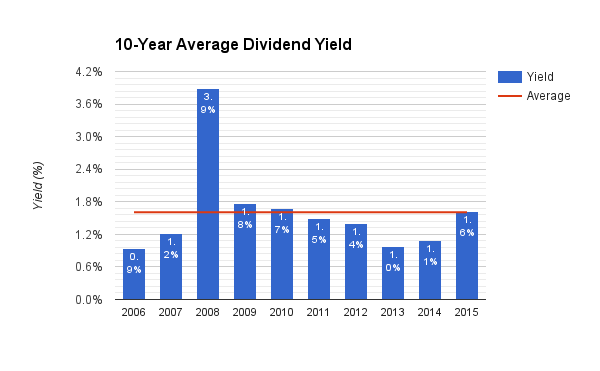
Yet what we are really looking for here is a well-covered dividend which looks secure and ready to grow. Consequently my tests here are for a:
- FCF yield (the yield if their entire FCF was paid out as a dividend) of 3.5% or more, and a;
- FCF payout ratio of 75% or less.
So how does American Express do here? Put simply: excellently. Despite their below average current historic yield of about 1.47% it is clear there is plenty of scope for growth: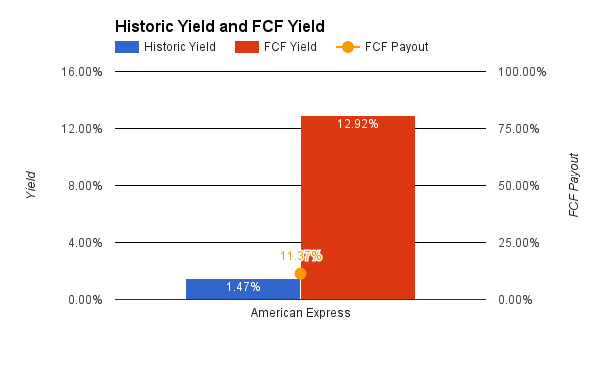
American Express pay out under 11.5% of their FCF as a dividend (well below my 75% target). Similarly, their FCF yield sits at a huge ~13% which is once again considerably ahead of my 3.5% or more target.
American Express thus have a very secure dividend with plenty of room for growing it into the future. They easily earn a PASS here.
5: FCF Valuation
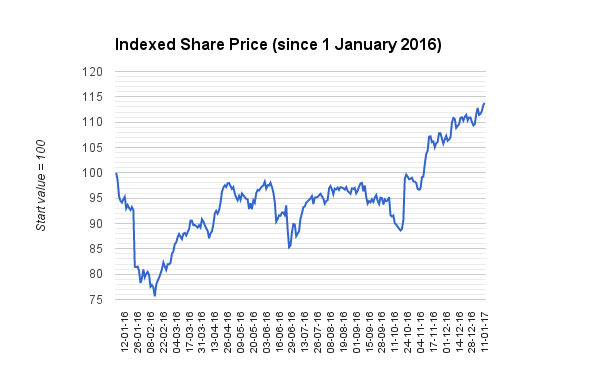
After a weak start to 2016, American Express has seen its share price lift considerably. This is especially true after the US Presidential Election result in November which has stimulated a great deal of optimism for accelerated growth in American Express's core US market:
So is there still value to be found in American Express's shares at present? Here we will turn to their historic EV/FCF (enterprise value to FCF) multiple over the more familiar P/E ratio. To pass this test, American Express just needs to come out with a share price below the FCF fair value calculated using this EV/FCF multiple.
To calculate this FCF fair value, we need to first ascertain American Express's historical EV/FCF average. Generally speaking, American Express has maintained a fairly consistent multiple:
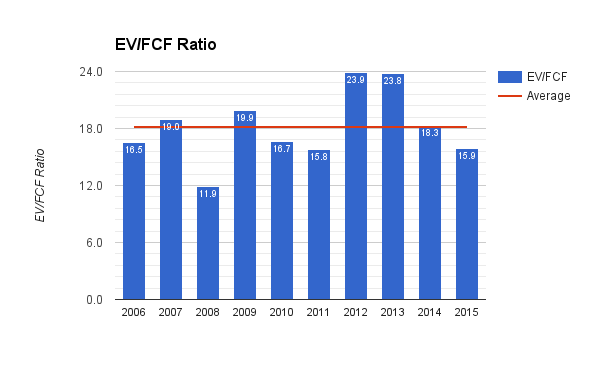
This emerges with a 10-year average EV/FCF multiple of 18.2. This we will use as their fair value multiple.
Next we have to predict the FCF figure for the next two years. You can read more on exactly how I predict future FCF in an earlier article. Using this method suggests FCF figures of about $8.83 billion and $8.81 billion in FCF in FY2016 and FY2017, respectively. I then average these two FCF figures (making $8.82 billion) and feed this back into the EV/FCF calculation at the average historic multiple of 18.2.
Doing so provide me with a FCF fair value of around $77.35. With American Express currently trading around $76 per share, this suggests that it is currently less than 2% below fair value.
Although hardly an impressive margin for error, American Express does therefore PASS this test by a small margin.
Conclusion
American Express presents a pretty confusing picture from my five FCF tests. It passed three out of the five. Yet the two which it failed-CROIC and FCF to Debt-were beginning to signal an improving trend looking into the future.
On the CROIC front, despite a robust and consistent performance over the last decade it has only rarely produced a figure above my targeted 10%. Yet in FY2015 it started what could potentially be a period of CROIC improvement. If this can be continued in their upcoming FY2016 results and FY2017 then this would be extremely encouraging indeed.
"Bad debt" levels have also been decreasing consistently for some years. Combined with FCF (generally) growing at the same time it seems likely that American Express will pass above the 25% FCF/Debt target I have sooner rather than later if they continue a similar trajectory in the future.
With a modest but well-covered dividend, undoubtedly very healthy FCF generation capabilities and what appears to be a fair if hardly bargain share price it has a great many appeals.
Nonetheless, the weaker (though certainly not weak) performances on the CROIC and debt fronts would make it unlikely to invest in them right now whilst other investment options are available.
Combined with the well-documented expiration of the Costco co-branded cards and the future loss of the Starwood co-branded cards after their acquisition by Marriott they do have a number of headwinds.
Yet it is undoubtedly an attractive business with an attractive market position (especially when you consider their more affluent customer base) and brand. It is certainly one I will be watching either for a valuation with greater margin for safety or for their remaining "fail" points above to tick over into "passes." I look forward to reading their FY2016 when they finally come out.
Notes
All graphs, tables and the calculations contained within them were created by the author unless otherwise noted. All data w as collected from publicly accessible company filings and reports. Creative Commons image reproduced from Flickr user 59937401@N07.
Interested in other high-quality, highly cash generative businesses? Please do consider subscribing to my new premium Seeking Alpha research service "UK Free Cash Flow Dividend Stars" focused on attractive potential investments in the United Kingdom.