The EIA reported a storage draw of -243 Bcf, bringing the total storage number to 2.917 Tcf. This compares to the -175 Bcf draw last year and the -170 Bcf draw for the five-year average.
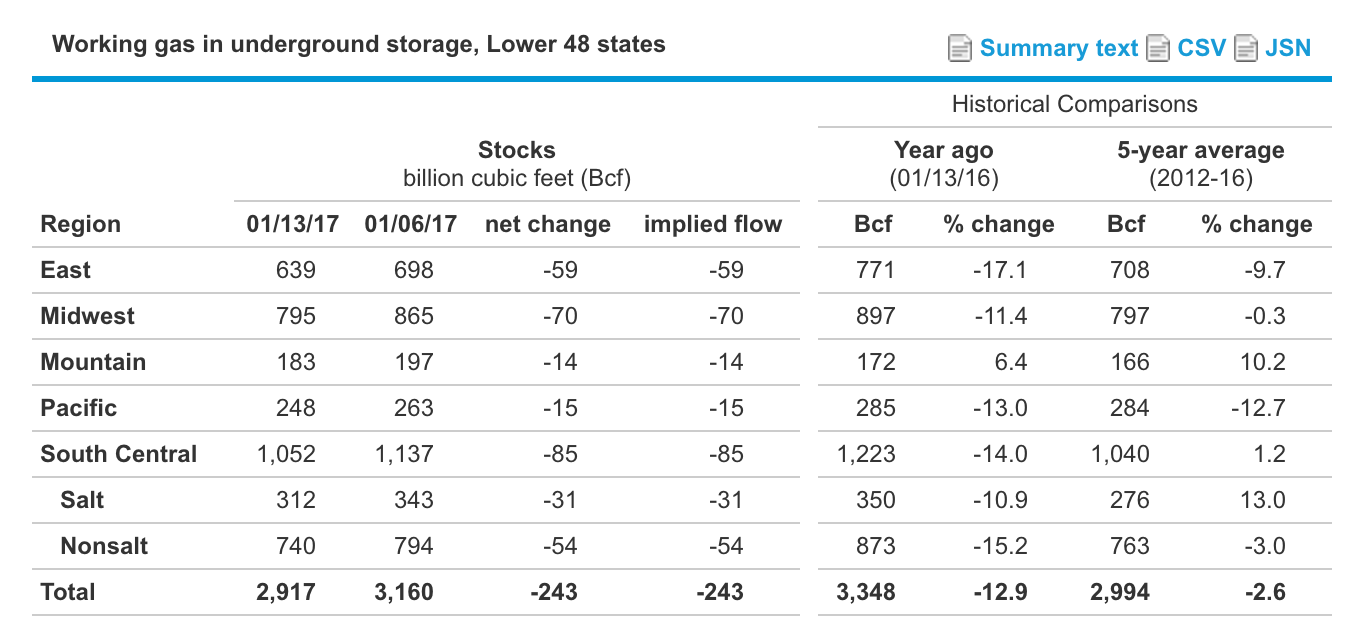
Source:EIA
Going into this report, a Reuters survey of 20 traders and analysts pegged the average at -231 Bcf with a range between -147 Bcf to -253 Bcf. We expected -251 Bcf, and our estimate was materially above the consensus average. We were off by 8 Bcf.
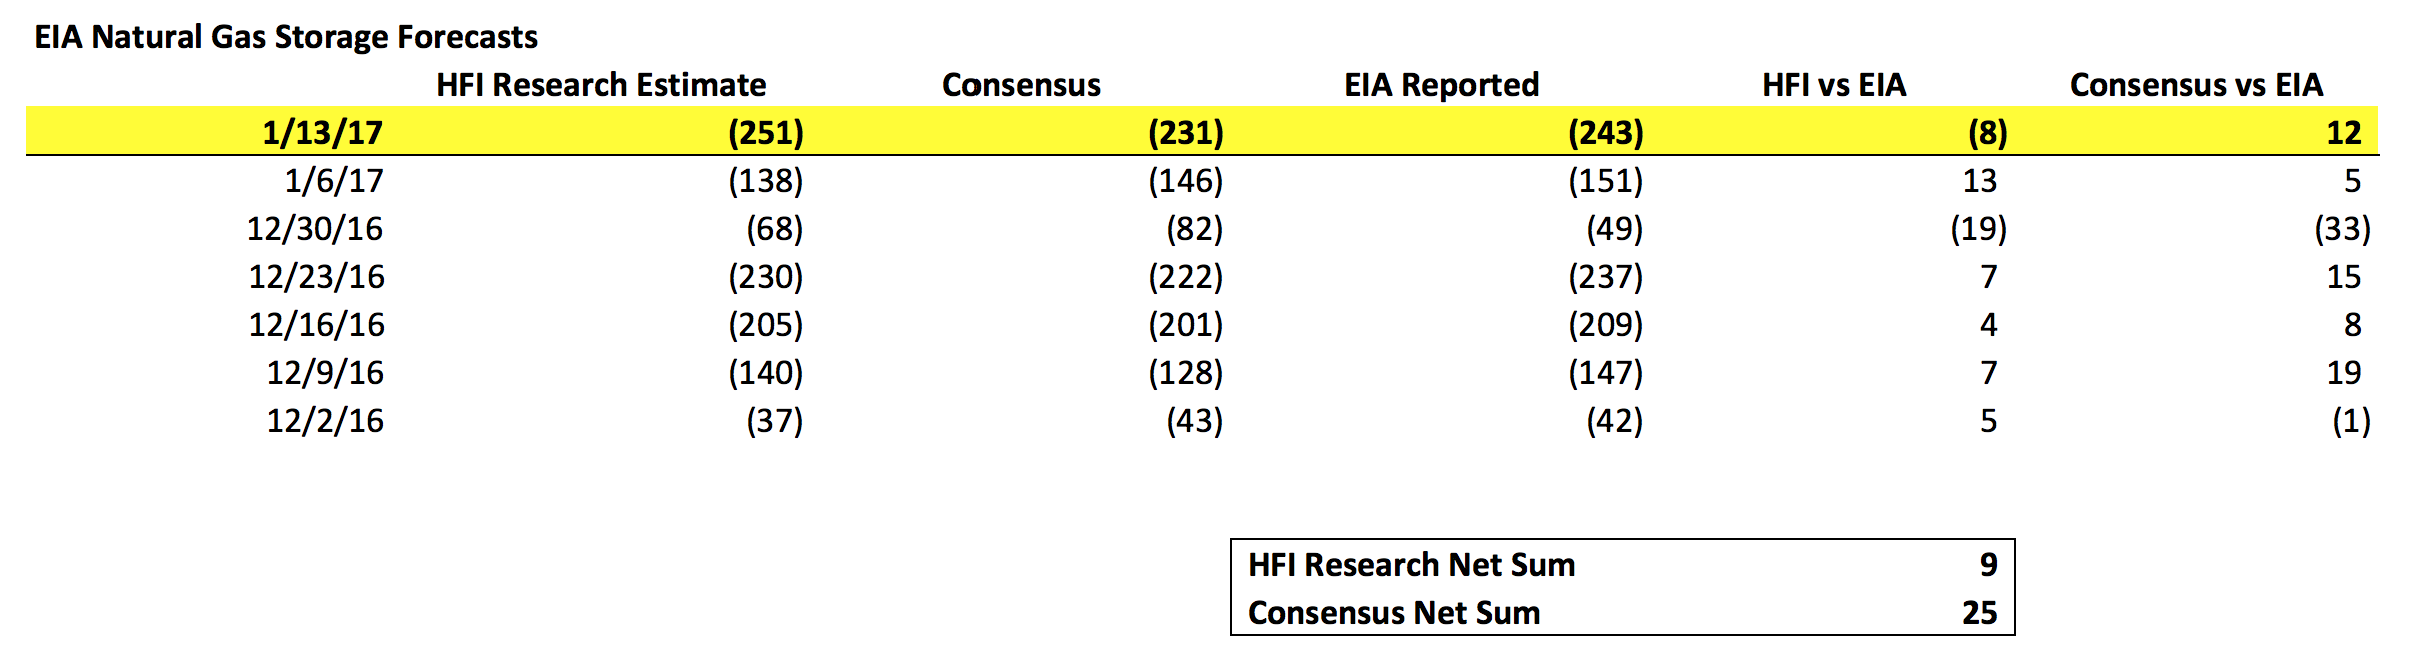
Natural Gas Storage Forecast Track Record; Source: HFI Research
Weather models after the week showed materially less storage draws than what the EIA reported. If we only used the weather demand model, the implied draw was around -215 Bcf. The structural imbalance explains the other 28 Bcf or so of storage draws. This equates to the 3.5 - 4 Bcf/d structural imbalance we've been talking about. We might sound like a broken record by now, but natural gas supplies need to either increase materially or demand needs to go down in order for the structural imbalance to close. Natural gas (NYSEARCA:UNG) demand is expected to increase further by another 2 Bcf/d over the next several months. If natural gas production does not rebound to the 74 Bcf/d we forecasted, then the structural imbalance by May will have widened to 6 Bcf/d. This is not practical.
The wide range in this week's estimate also highlights the markets' misunderstanding of just how big the structural imbalance is at the moment. It's significant to the point where it will throw weather demand models off by over 10%. Although weather forecasts for the next two weeks remain grim, and our storage forecasts do not exude bullishness, it's important to remember that weather can change, but the structural imbalance won't anytime soon.
Overall, with the structural imbalance in place, we remain very bullish on natural gas prices for the next 18 months, and you can read our 2017 outlook here. If you are interested in getting our storage forecasts four weeks in advance, you can sign up here.