The U.S. stock market is currently in the second longest bull market in history. This fact alone has raised understandable concerns for many investors that a new bear market is overdue if for no other reason than the natural cyclicality of the economy and the financial system. But when digging under the surface of the current bull market, a worthwhile question should be raised. Did we just emerge from what was effectively a bear market over the last couple of years?

Bull!
How could we have possibly experienced a bear market over the past few years? Sure, stocks endured a difficult stretch from May 2015 through February 2016 that included two measurable drawdowns and the break of several key technical uptrend lines. But the peak to trough decline on the S&P 500 Index throughout the entire episode was limited to just over -15% and was only nine months in duration.

In short, not only did the magnitude of the decline on the S&P 500 Index not meet the widely accepted bear market criteria of a -20%, the duration of the decline from peak to trough was notably short for a typical bear market.
Rolling Bears
So the headline S&P 500 Index never officially entered a bear market during what was a turbulent stretch over the last couple of years. But what about the various components that make up the S&P 500 Index? More specifically, what was the individual experience of the eleven sectors that make up the benchmark index? Is it possible that we had a series of rolling bear markets underneath the surface of a broader market that was able to rise above it all?
Let's take a closer look by starting with the energy sector (NYSEARCA:XLE). Not surprisingly, the energy sector suffered a major bear market over the last couple of years. Over a period of 19 months from June 2014 to January 2016, the energy sector plunged from peak to trough by -49% along with the collapse in oil prices.

The energy sector was not alone in crumbling over the past couple of years in the commodities space, as the materials sector (NYSEARCA:XLB) also plunged by -29% from peak to trough in just over 10 months from February 2015 to January 2016.

How about the industrials (NYSEARCA:XLI), which is by far the most highly correlated sector to the broader S&P 500 Index? Although it did not officially cross the line into bear market territory, it came very close. Almost identical to the materials sector albeit at a lesser magnitude, the industrials sector declined by -18% in just over 10 months from February 2015 to January 2016.

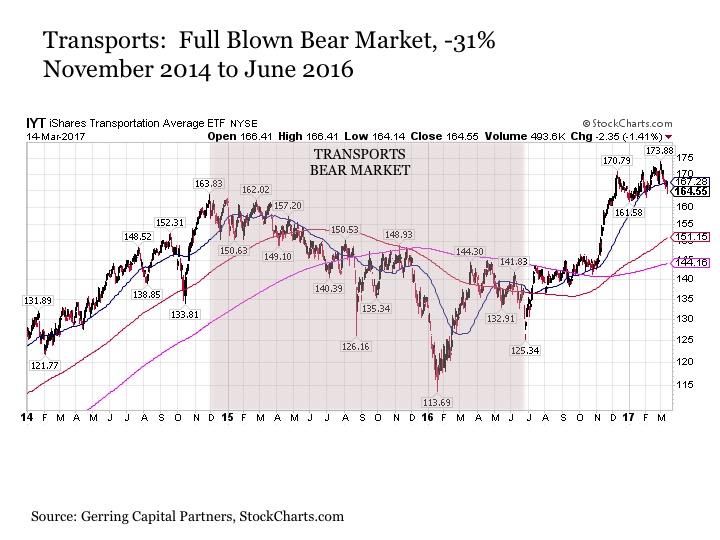
And when digging beneath the surface of the industrials sector, we see key sub-segments like the transportation industry that plunged into a full blown bear market with a peak to trough -31% decline over a corrective period that stretched over 19 months before the final bottom was in place.
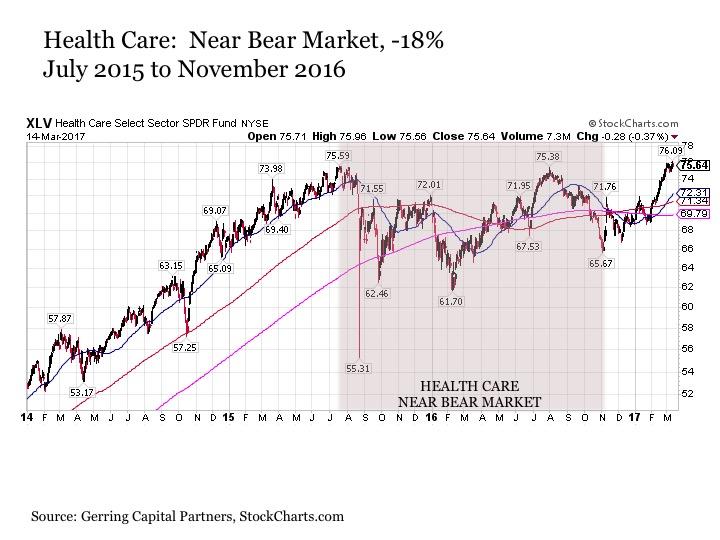
Let's skip ahead to the health care sector (NYSEARCA:XLV), which has been dealing with its own separate set of issues including concerns about the uncertainty associated with health care reform and government intervention on rising drug prices. Much like the industrials sector, it did not cross the line into official bear market territory, but it came very close at -18%. But unlike the other segments mentioned to this point, the corrective period came later by starting in July 2015 and not coming to an end until effectively Election Day in November 2016.
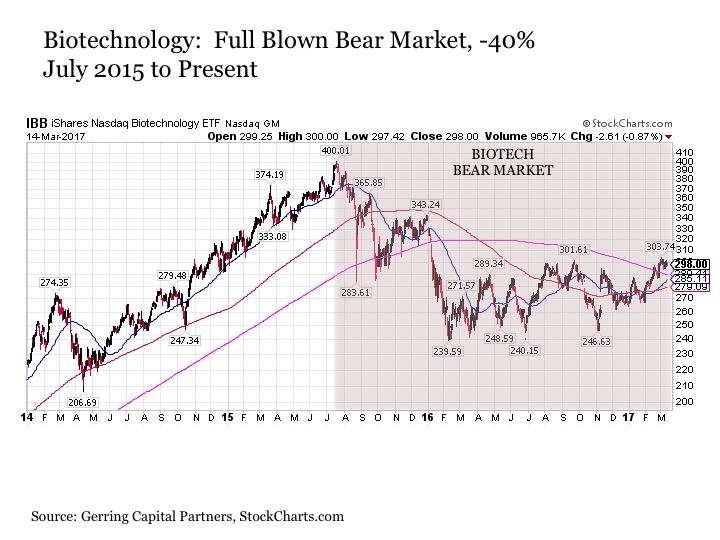
And just like the industrials sector, health care has sub-segments like biotech (NASDAQ:IBB) that plunged into a full blown bear market. Overall, biotech fell by -40% from its June 2015 peak to trough. And while the industry has made meaningful progress over the past many months, it could still be argued that biotech still remains mired in a bear market more than 20 months later.
Moving on to the recently revitalized financial sector (NYSEARCA:XLF), much like the health care sector, its correction came later in the recent cycle and resulted in what could be considered an actual bear market. Overall, financial stocks declined by -23% from peak to trough in a corrective period that lasted 11 months from July 2015 to June 2016.

REITs (NYSEARCA:VNQ), the recently separated cousin to financials, also endured a difficult stretch during the recent cycle, but their correction came much earlier and at a modestly lower magnitude. REITs started to enter into correction in January 2015 and bottomed 13 months later in February 2016. Along the way, they declined by -18%, thus falling into near bear market territory.

Even the more defensive telecom sector (BATS:IYZ) could not avoid dipping into bear market territory during the recent cycle. Following a prolonged period of sideways trading throughout 2014 into 2015, telecom finally topped out in April 2015 before declining by -21% from peak to trough roughly 9 months later in January 2016.

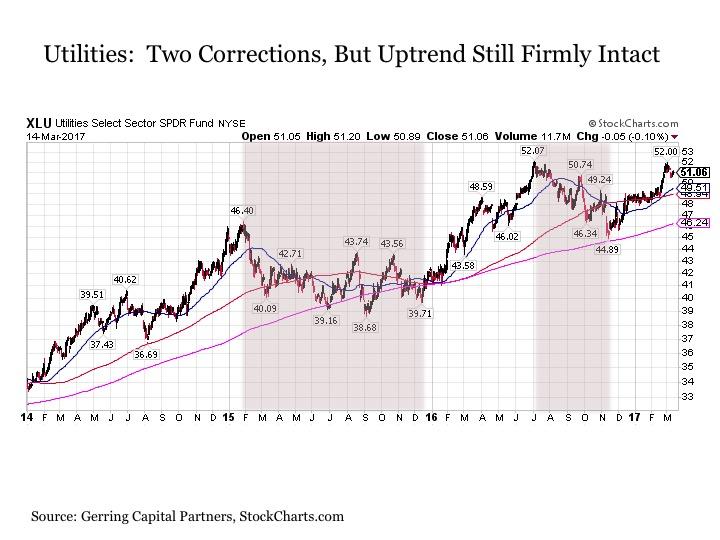
A similar story could be told for the defensive utilities (NYSEARCA:XLU) sector, which peaked in January 2015 and spent much of the rest of the year through December 2015 mean reverting and consolidating gains in the process by declining by -17% from peak to trough along the way. A similar correction took place again from July 2016 to November 2016, when utilities dropped by -14% after running well ahead of themselves earlier in the year. What is notable about these pullbacks in utilities is that despite their magnitude, the uptrend in the sector remained firmly intact and continued without interruption.
What about the technology sector (NYSEARCA:XLK)? While it had a few mini corrections during the recent cycle including a short but sharp -14% from December 2015 to January 2016, it has remained firm to the upside much like the broader market.
How about the resilient consumer? Much like technology, the consumer discretionary sector (NYSEARCA:XLY) also sustained a short but sharp -17% correction from December 2015 to January 2016, the sector uptrend has remained firmly intact. This is even more so true for consumer staples (NYSEARCA:XLP), which outside of a mean reverting -10% decline from July 2016 to November 2016 has risen virtually without interruption throughout the entire cycle over the past few years.
The Positives From The Rolling Bears
The fact that many of the various sectors that underlie the benchmark S&P 500 Index (NYSEARCA:SPY) have experienced their own individual bear markets or near bear markets is significant for the following reason. While they are unpleasant for investors to endure, bear markets serve and important and healthy function for financial markets. This is due to the fact that bear markets help cleanse the excesses that are accumulated from the previous bull market. Thus, the various individual bears and near bears at the sector and industry level suggest that at least some of the excesses accumulated in various segments of the market were cleansed at various times during the period from mid-2014 to late 2016. And the fact that this disaggregated cleansing process took place at different points along the way during this more than two-year period enabled the broader combined stock market to continue grinding higher on the most part despite the underlying bears and near bears that were rolling along the way. And this recent cleansing may ultimately prove to be enough of a reset to propel the broader S&P 500 Index on the next leg higher in its ongoing bull market run.
The Drawbacks From The Rolling Bears
An important key question remains from the rolling corrective cycle that took place over the past few years, however. While various segments of the broader market did indeed undergo at least some form of cleansing during the recent cycle, it stands to reason whether the degree of cleansing was truly enough at the end of the day. For one of the key attributes in washing out the excesses in financial markets is seeing valuations not only mean revert, but actually shift from premiums to discounts relative to their long-term averages. But such a valuation wash out simply did not take place neither for the broader market nor for nearly all of the sectors that suffered bear or near bear markets during this stretch. In fact, most sectors remained just as expensive if not notching a higher premium in some cases given the fact that underlying earnings were declining more than stock prices during these pullback phases.
The Bottom Line
While the second longest bull market in U.S. stock market history remains firmly intact, the good news from a continuation standpoint is that a variety of sectors that make up the broader market experienced their own individual bear markets in recent years. This implies that the market may have had a chance to cleanse and recharge over the last few years in preparing for its next leg higher. The only problem with this conclusion, however, is that the recent rolling bear markets across sectors not only did not clear the premium valuation overhang, but the problem was actually compounded in the process.
This implies the following for stocks going forward. The broader market may increasingly struggle to push to the upside, as its recent spurt since Election Day may have exhausted any of the renewed upside vigor resulting from the cleansing process that took place across sectors to varying degrees underneath the market surface. What this suggests instead is that some of the best stock market opportunities going forward will be found at the sector or individual stock level where a more meaningful cleansing process has actually taken place over the past few years. And at the moment, the sector that has looked the most appealing in this regard over the last few months has been health care including the pharmaceutical (NYSEARCA:IHE) industry.
Disclosure: This article is for information purposes only. There are risks involved with investing including loss of principal. Gerring Capital Partners makes no explicit or implicit guarantee with respect to performance or the outcome of any investment or projections made. There is no guarantee that the goals of the strategies discussed by Gerring Capital Partners will be met.